Apollo Global Management Mergers and Acquisitions Presentation Deck
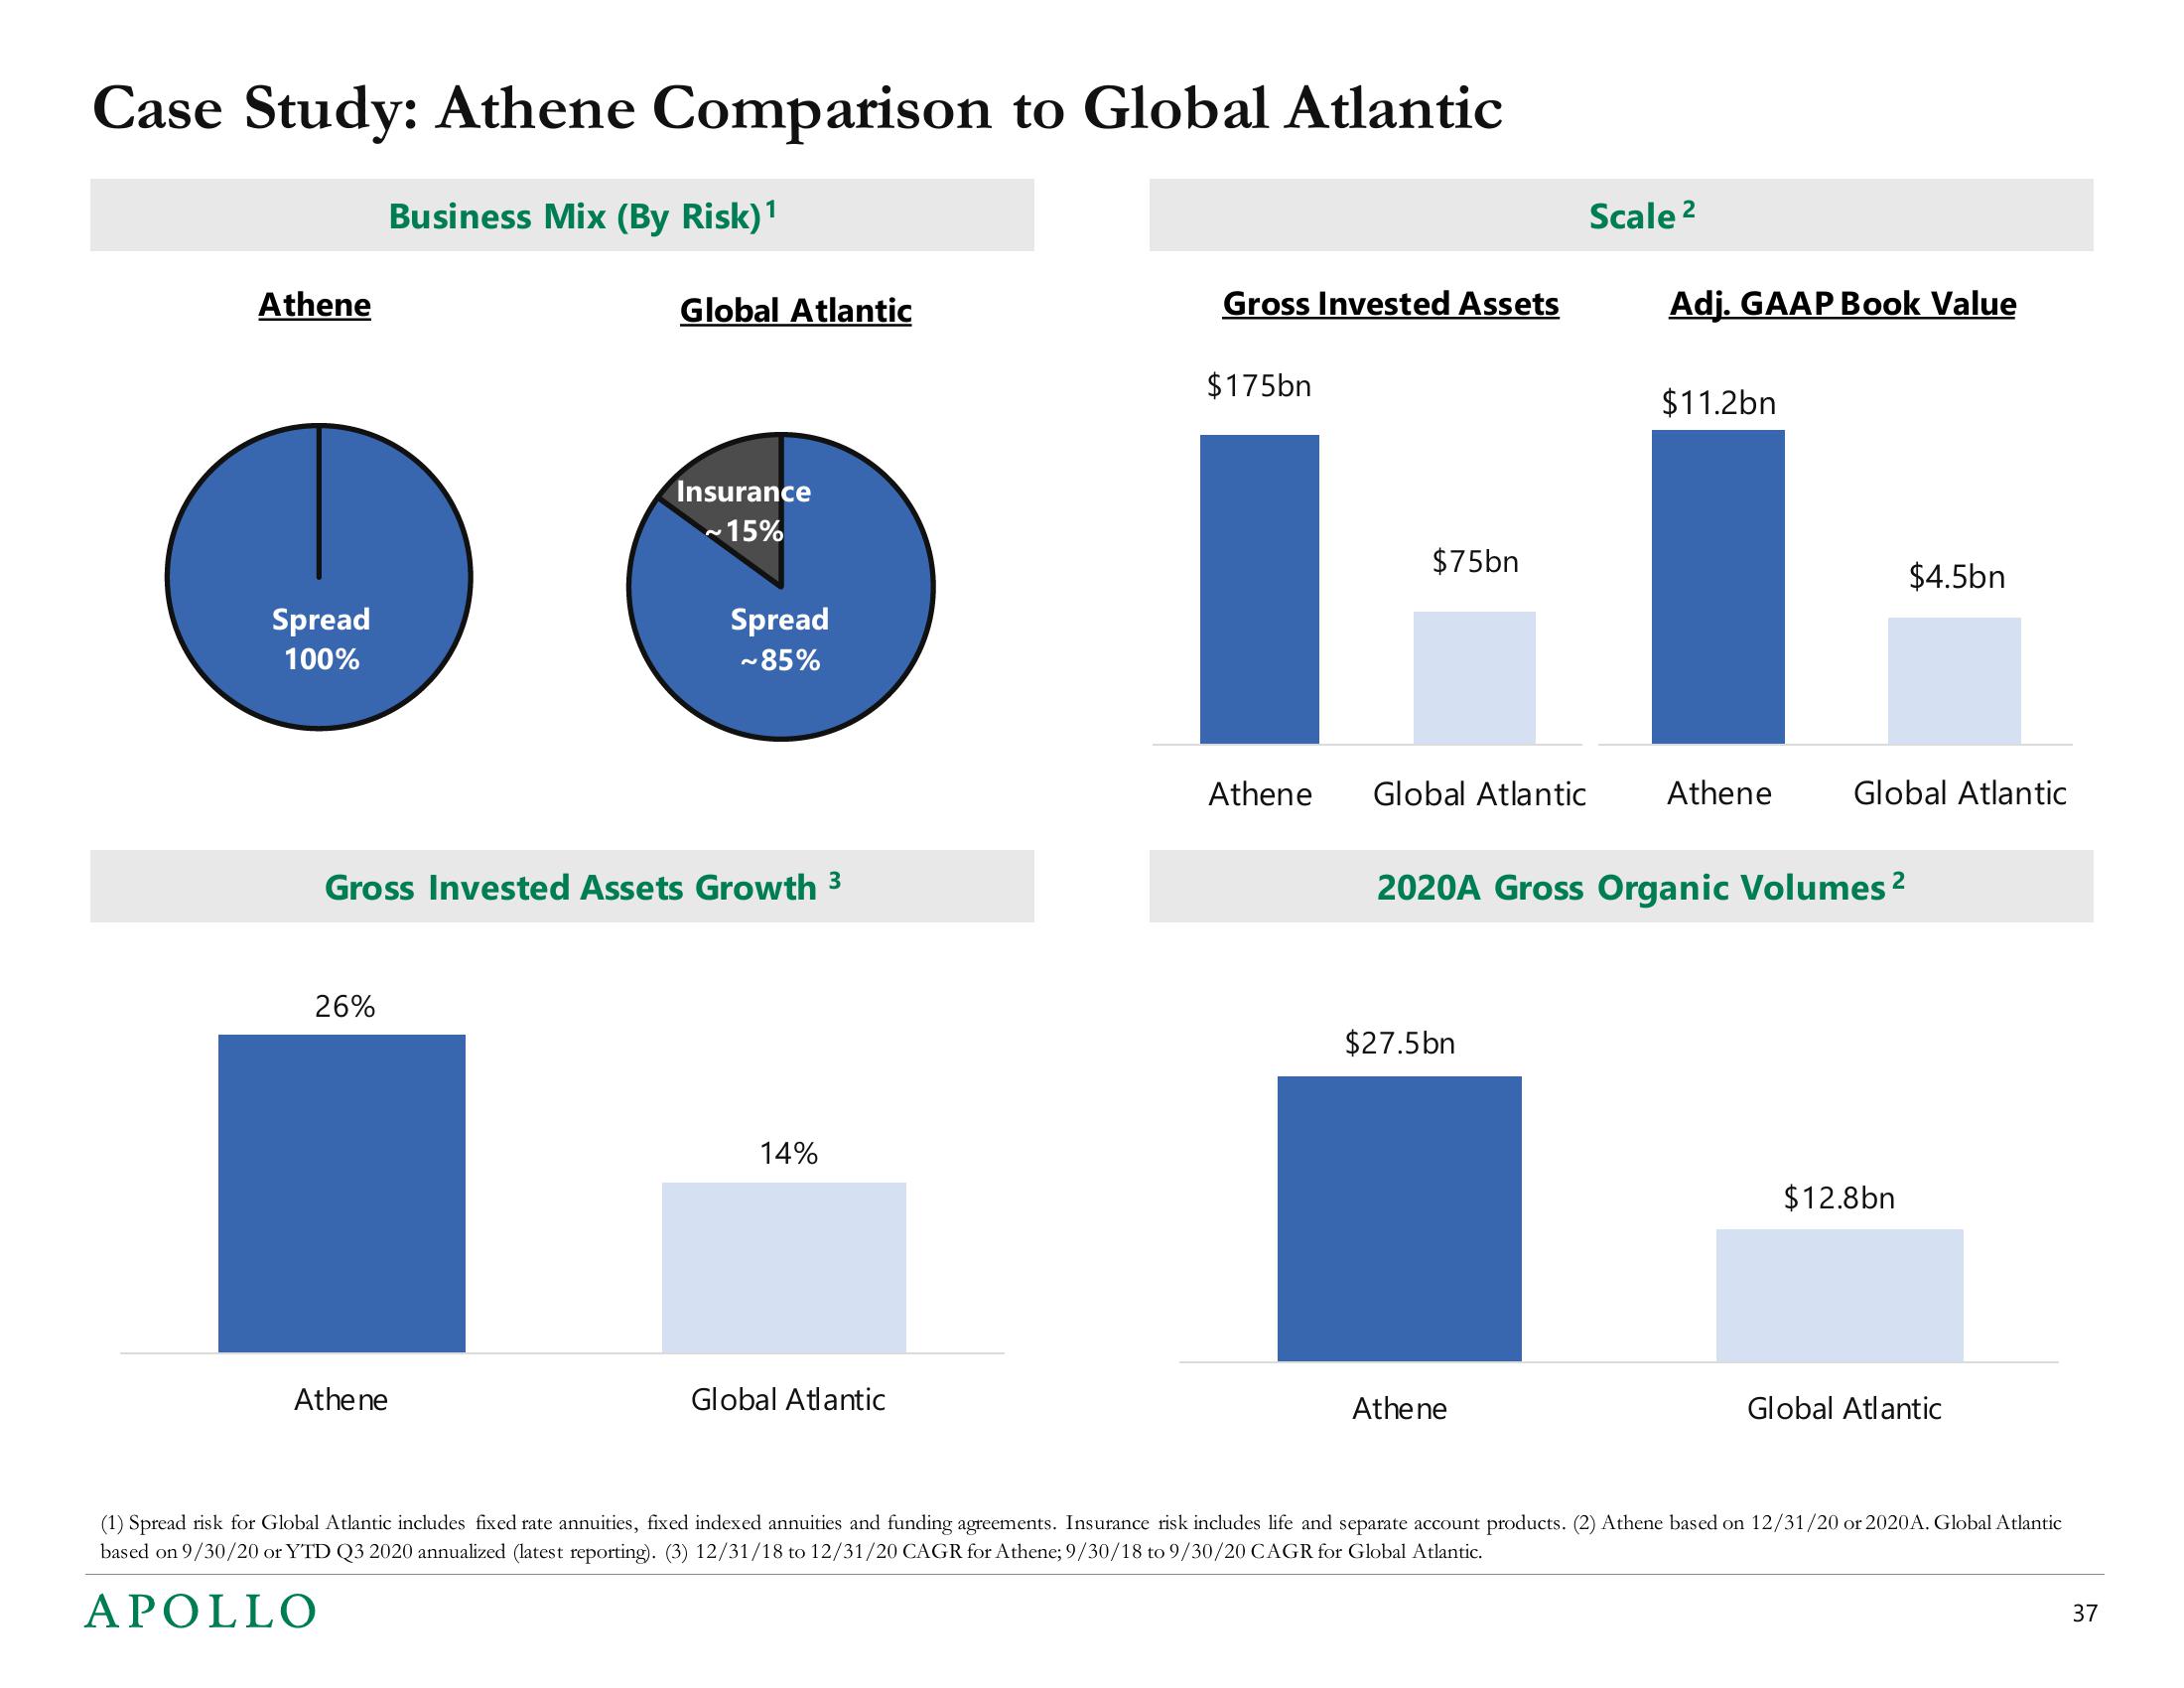
Case Study: Athene Comparison to Global Atlantic
Business Mix (By Risk) ¹
Athene
Spread
100%
26%
Global Atlantic
Athene
Insurance
~15%
Gross Invested Assets Growth 3
Spread
~85%
14%
Global Atlantic
Gross Invested Assets
$175bn
$75bn
Athene Global Atlantic
$27.5bn
Scale ²
Athene
Adj. GAAP Book Value
$11.2bn
Athene
2020A Gross Organic Volumes ²
Global Atlantic
$4.5bn
$12.8bn
Global Atlantic
(1) Spread risk for Global Atlantic includes fixed rate annuities, fixed indexed annuities and funding agreements. Insurance risk includes life and separate account products. (2) Athene based on 12/31/20 or 2020A. Global Atlantic
based on 9/30/20 or YTD Q3 2020 annualized (latest reporting). (3) 12/31/18 to 12/31/20 CAGR for Athene; 9/30/18 to 9/30/20 CAGR for Global Atlantic.
APOLLO
37View entire presentation