Morgan Stanley Investment Banking Pitch Book
Project Roosevelt
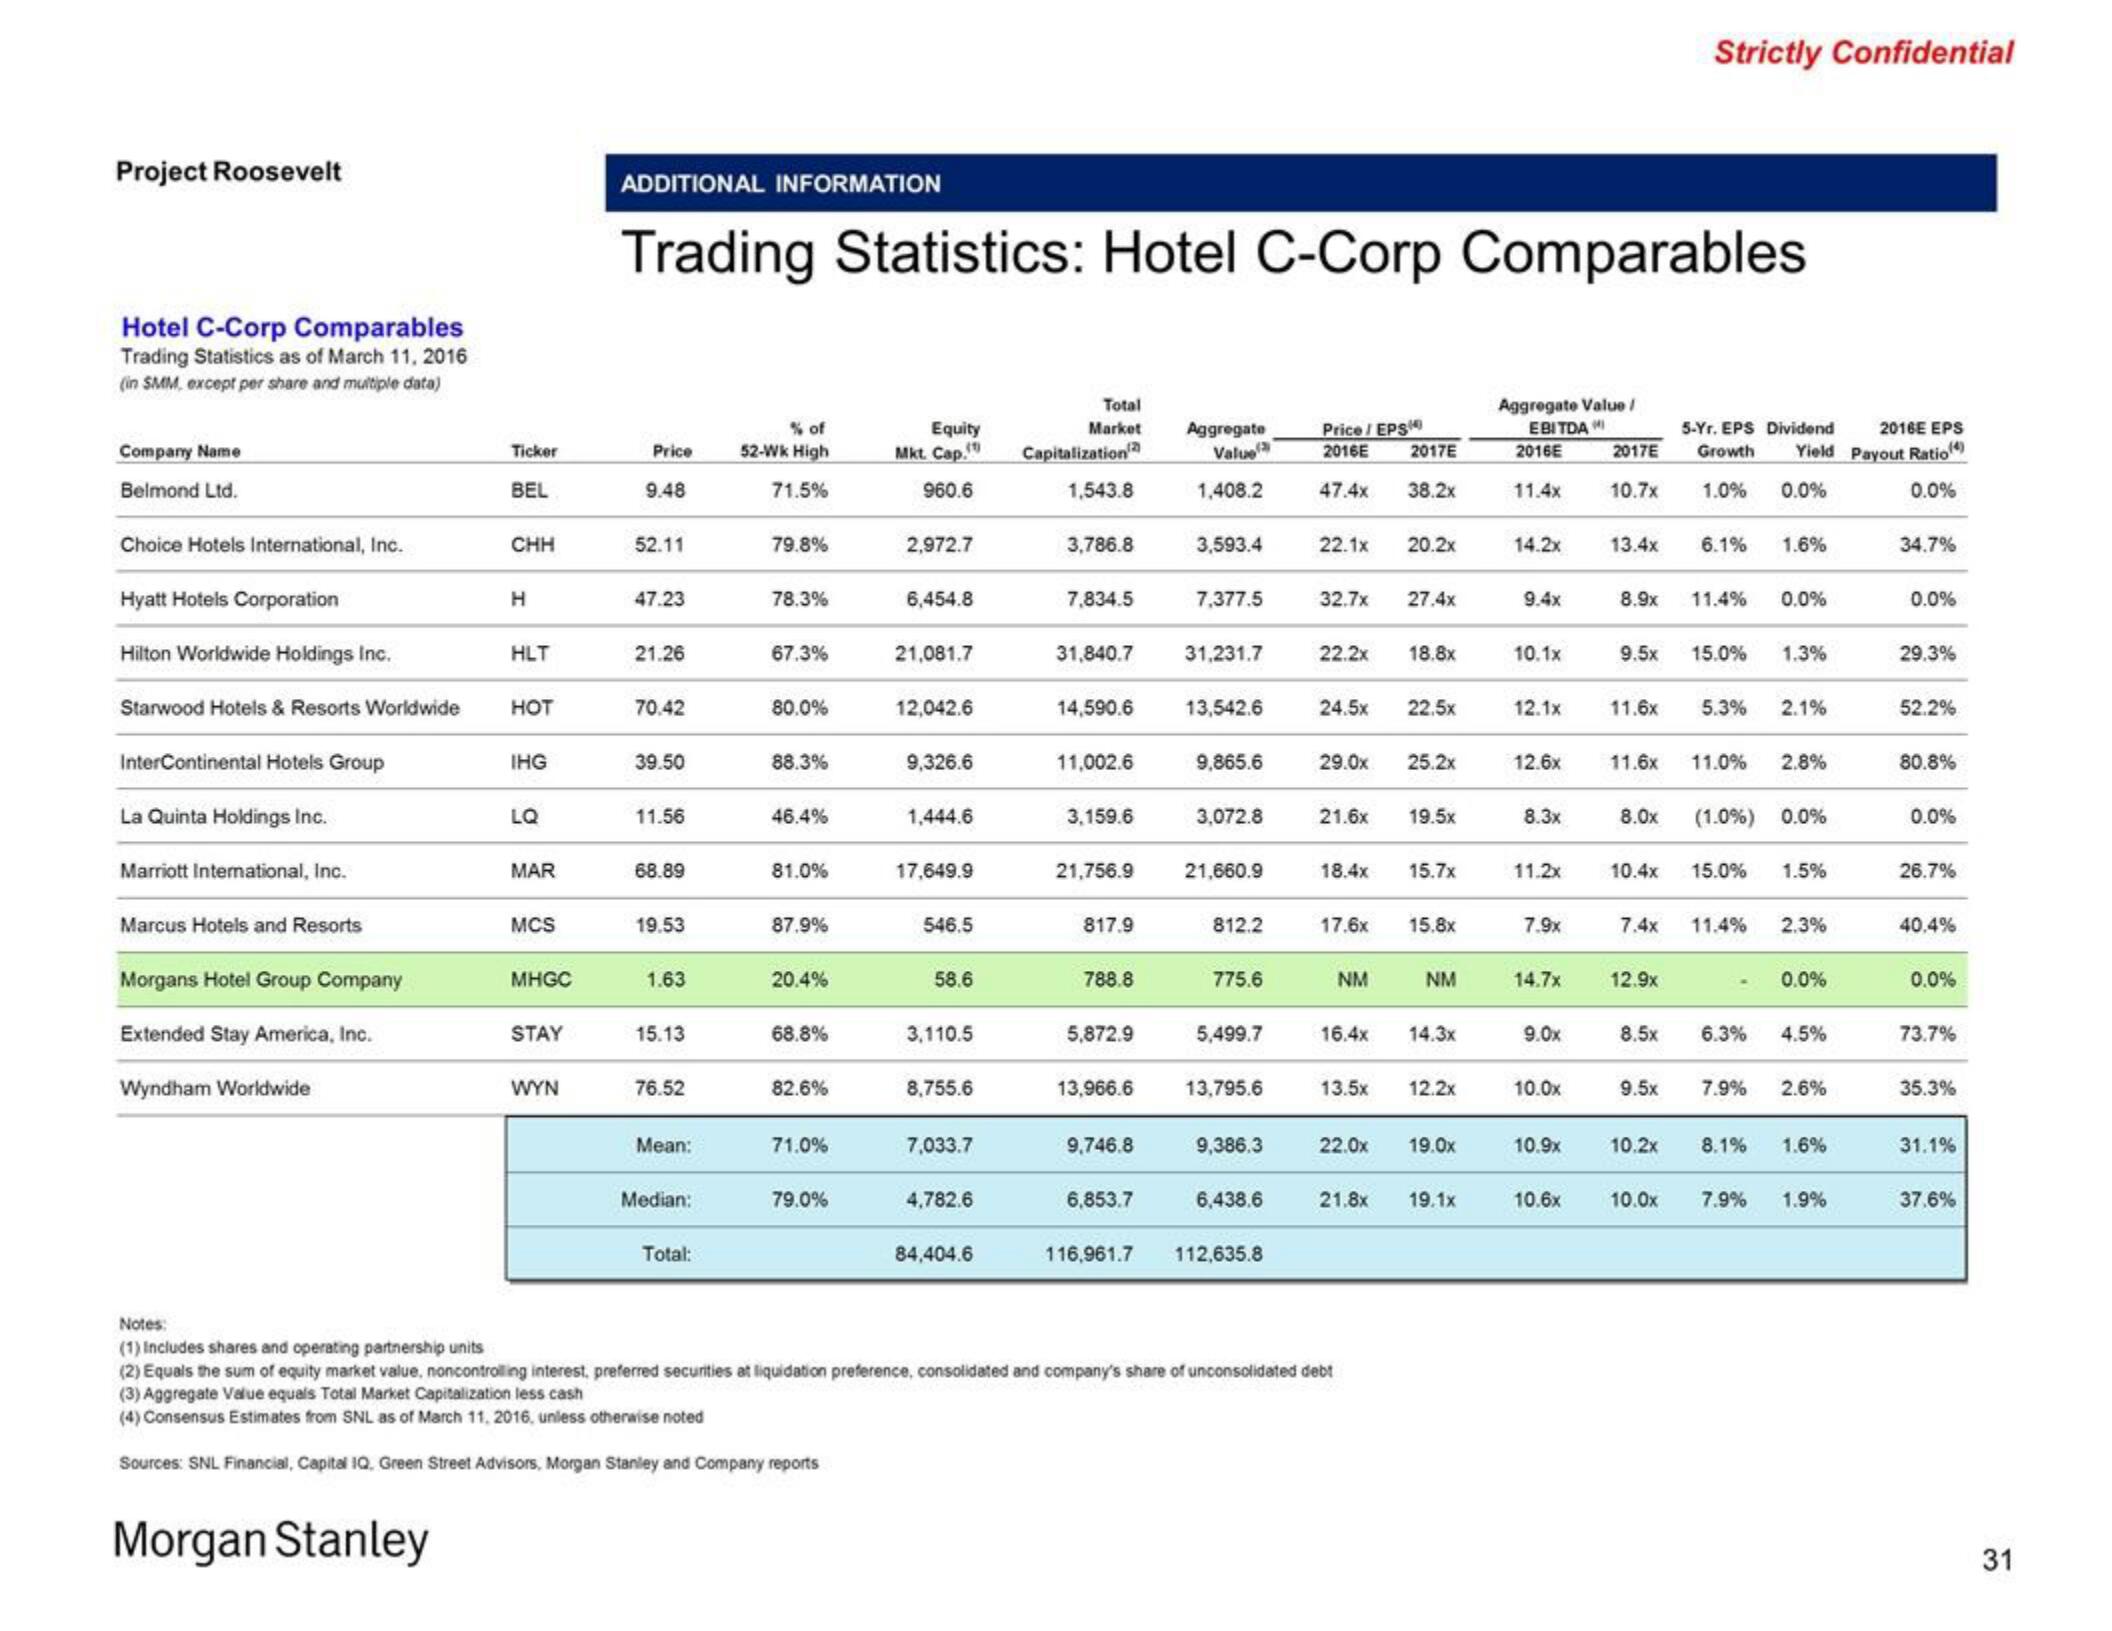
Hotel C-Corp Comparables
Trading Statistics as of March 11, 2016
(in SMM, except per share and multiple data)
Company Name
Belmond Ltd.
Choice Hotels International, Inc.
Hyatt Hotels Corporation
Hilton Worldwide Holdings Inc.
Starwood Hotels & Resorts Worldwide
InterContinental Hotels Group
La Quinta Holdings Inc.
Marriott International, Inc.
Marcus Hotels and Resorts
Morgans Hotel Group Company
Extended Stay America, Inc.
Wyndham Worldwide
Ticker
BEL
Morgan Stanley
CHH
H
HLT
HOT
IHG
LQ
MAR
MCS
MHGC
STAY
WYN
ADDITIONAL INFORMATION
Trading Statistics: Hotel C-Corp Comparables
Price
9.48
52.11
47.23
21.26
70.42
39.50
11.56
68.89
19.53
1.63
15.13
76.52
Mean:
Median:
Total:
% of
52-Wk High
71.5%
79.8%
78.3%
67.3%
80.0%
88.3%
46.4%
81.0%
87.9%
20.4%
68.8%
82.6%
71.0%
79.0%
Equity
Mkt. Cap.
960.6
2,972.7
6,454.8
21,081.7
12,042.6
9,326.6
1,444.6
17,649.9
546.5
58.6
3,110.5
8,755.6
7,033.7
4,782.6
84,404.6
Total
Market
Capitalization
1,543.8
3,786.8
7,834.5
31,840.7
11,002.6
3,159.6
21,756.9
14,590.6 13,542.6
817.9
788.8
5,872.9
13,966.6
9,746.8
Aggregate
Value
1,408.2
6,853.7
3,593.4
7,377.5
31,231.7
9,865.6
3,072.8
21,660.9
812.2
775.6
5,499.7
13,795.6
9,386.3
6,438.6
116,961.7 112,635.8
Price/ EPS
2016E
47.4x
32.7x
22.1x 20.2x
22.2x
24.5×
17.6x
2017E
38.2x
29.0x 25.2x
NM
21.6x 19.5x
27.4x
18.4x 15.7x
22.0x
Notes:
(1) Includes shares and operating partnership units
(2) Equals the sum of equity market value, noncontrolling interest, preferred securities at liquidation preference, consolidated and company's share of unconsolidated debt
(3) Aggregate Value equals Total Market Capitalization less cash
(4) Consensus Estimates from SNL as of March 11, 2016, unless otherwise noted
Sources: SNL Financial, Capital IQ. Green Street Advisors, Morgan Stanley and Company reports
18.8x
21.8x
22,5×
16.4x 14.3x
15.8x
13.5x 12.2x
NM
19.0x
19.1x
Aggregate Value /
EBITDAI
2016E
11.4x
14.2x
9.4x
10.1x
12.6x
8.3x
11.2x
12.1x 11.6x
7.9x
14.7x
9.0x
10.0x
2016E EPS
5-Yr. EPS Dividend
2017E Growth Yield Payout Ratio (4)
10.7x
1.0%
0.0%
0.0%
13.4x
10.6x
8.9x
9.5x
7.4x
Strictly Confidential
12.9x
8.5x
9.5x
10.9x 10.2x
6.1% 1.6%
11.6x 11.0% 2.8%
10.4x 15.0%
11.4% 0.0%
8.0x (1.0%) 0.0%
10.0x
15.0%
5.3%
11.4%
6.3%
1.3%
2.1%
8.1%
7.9%
1.5%
2.3%
0.0%
7.9% 2.6%
4.5%
1.6%
1.9%
34.7%
0.0%
29.3%
52.2%
80.8%
0.0%
26.7%
40.4%
0.0%
73.7%
35.3%
31.1%
37.6%
31View entire presentation