SmileDirectClub Results Presentation Deck
●
Balance sheet highlights.
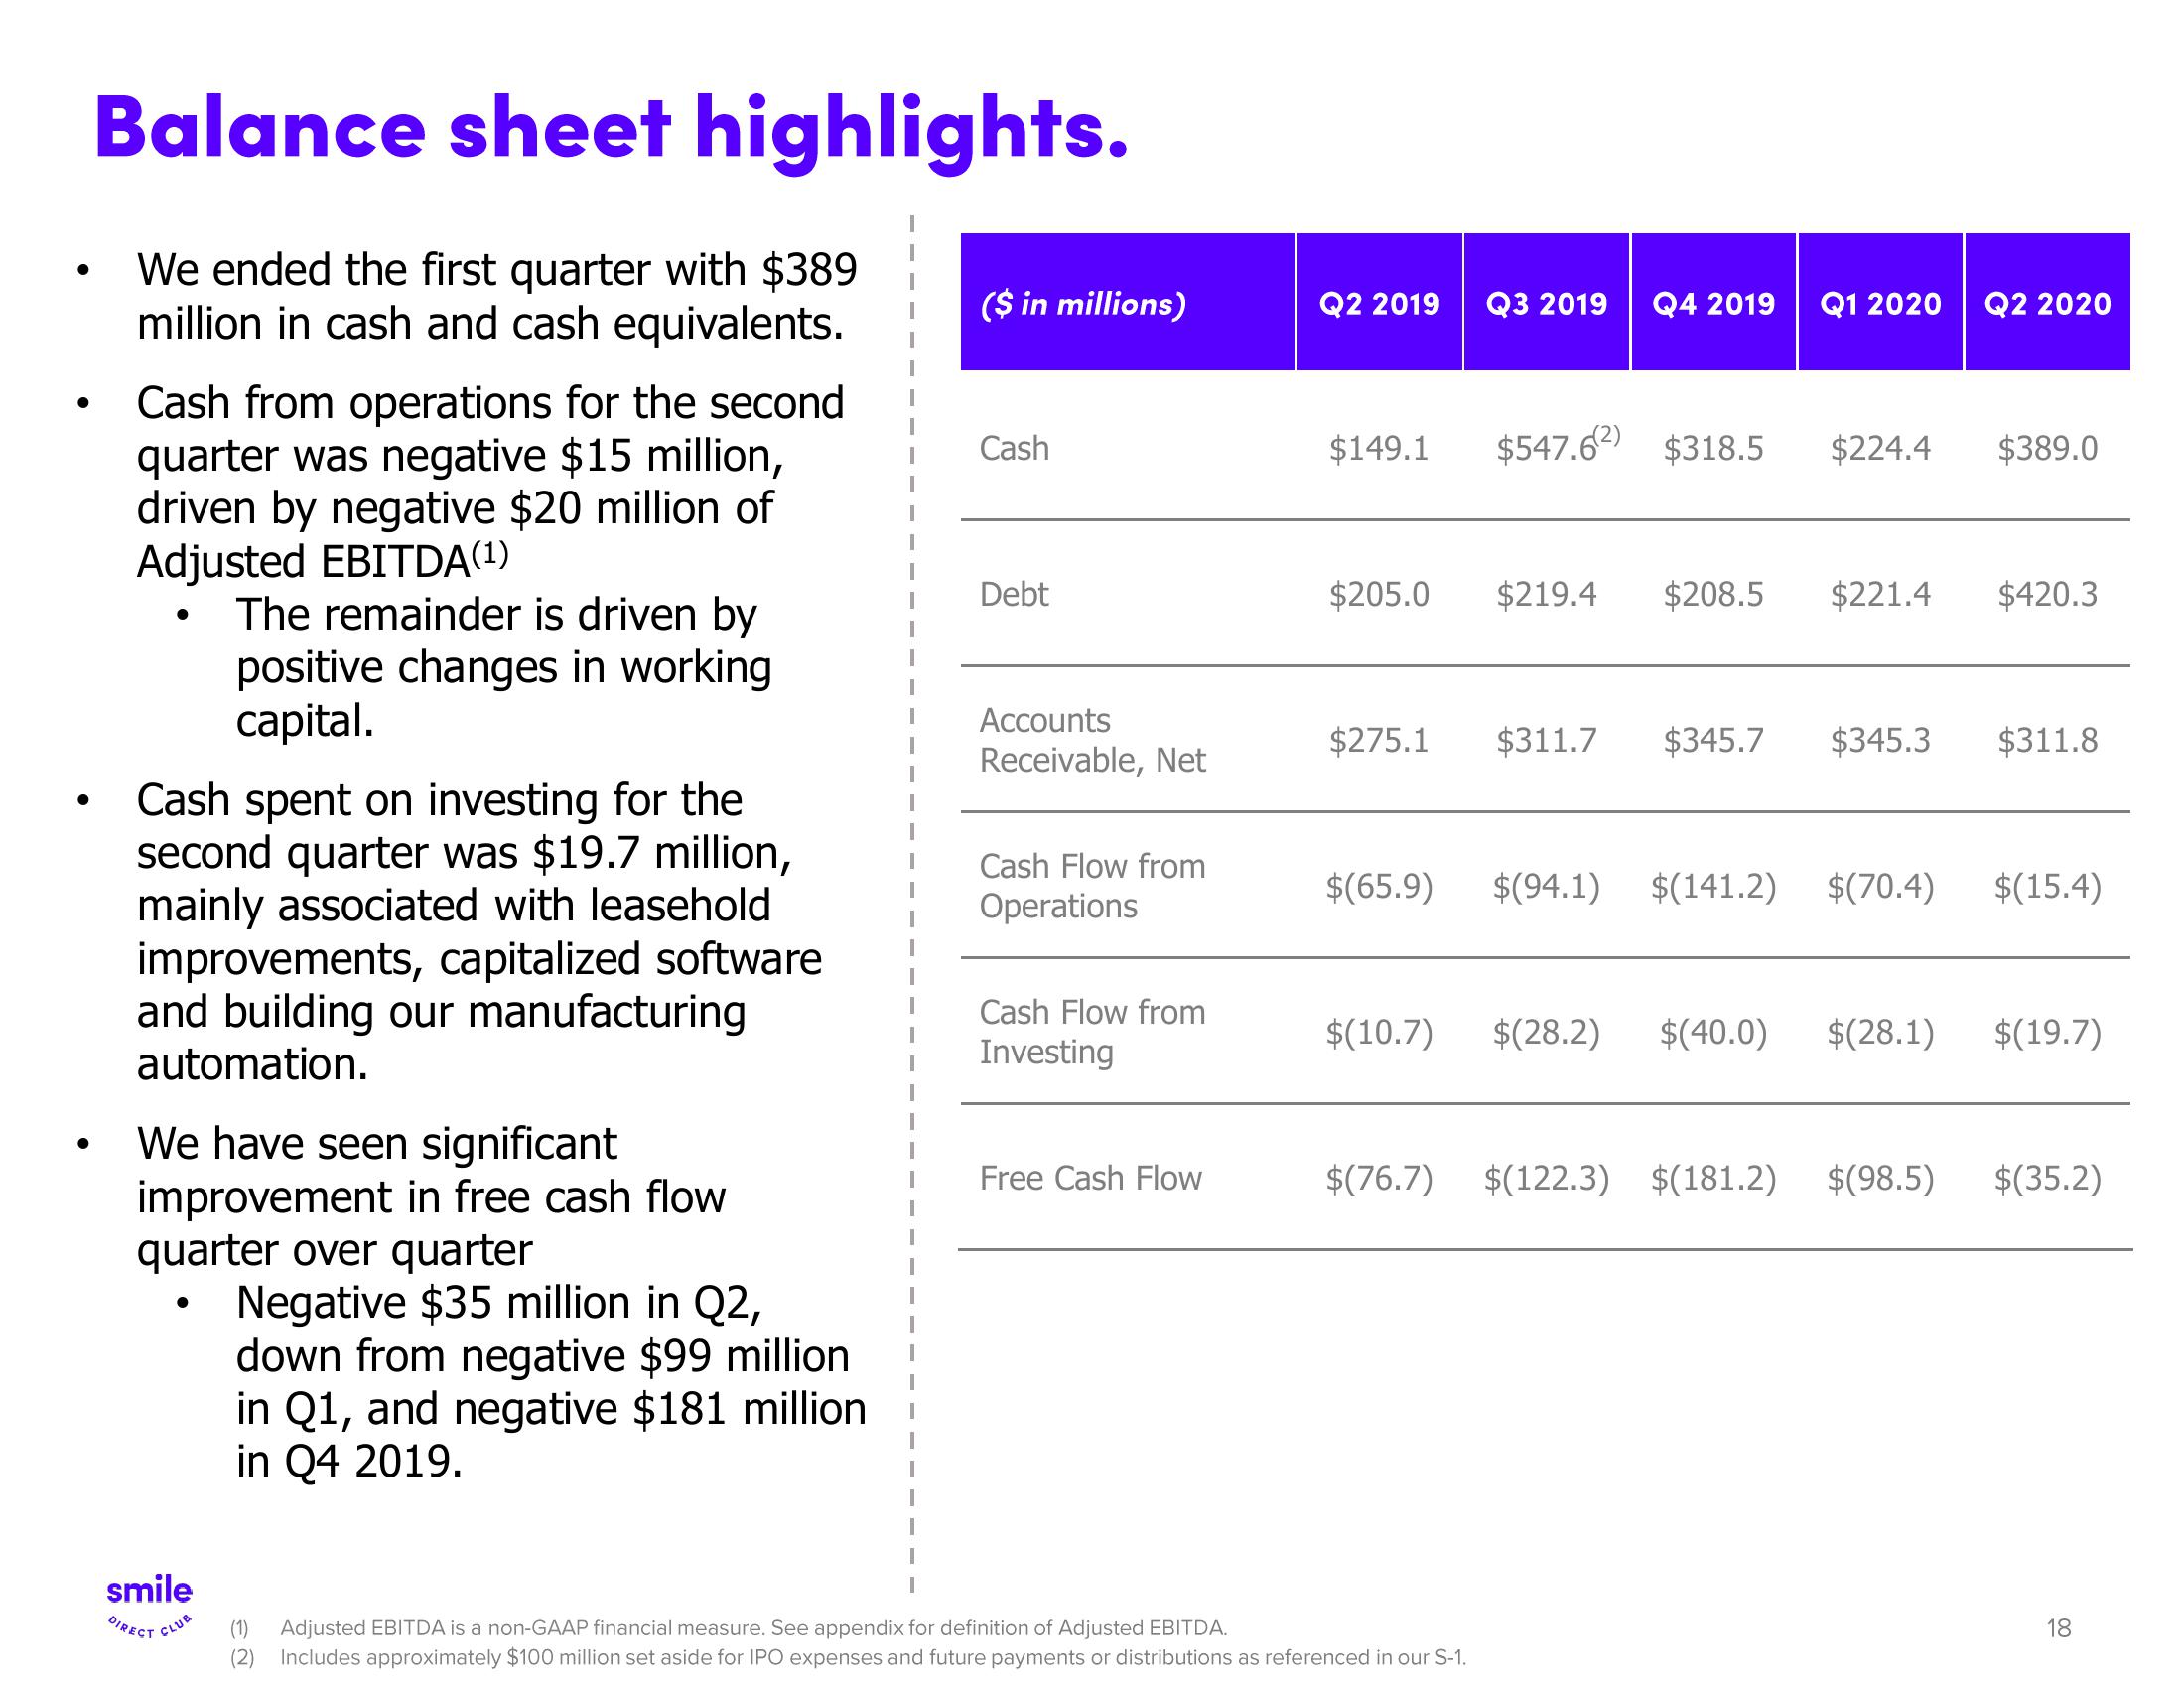
We ended the first quarter with $389
million in cash and cash equivalents.
Cash from operations for the second
quarter was negative $15 million,
driven by negative $20 million of
Adjusted EBITDA(1)
The remainder is driven by
positive changes in working
capital.
Cash spent on investing for the
second quarter was $19.7 million,
mainly associated with leasehold
improvements, capitalized software
and building our manufacturing
automation.
We have seen significant
improvement in free cash flow
quarter over quarter
Negative $35 million in Q2,
●
smile
DIRECT CLUB
down from negative $99 million
in Q1, and negative $181 million
in Q4 2019.
($ in millions)
Cash
Debt
Accounts
Receivable, Net
Cash Flow from
Operations
Cash Flow from
Investing
Free Cash Flow
Q2 2019
$149.1
$205.0
$275.1
Q3 2019 Q4 2019
$547.62 $318.5
Q1 2020 Q2 2020
(1) Adjusted EBITDA is a non-GAAP financial measure. See appendix for definition of Adjusted EBITDA.
(2) Includes approximately $100 million set aside for IPO expenses and future payments or distributions as referenced in our S-1.
$224.4
$219.4 $208.5 $221.4 $420.3
$389.0
$311.7 $345.7 $345.3 $311.8
$(65.9) $(94.1) $(141.2) $(70.4) $(15.4)
$(10.7) $(28.2) $(40.0) $(28.1)
$(76.7) $(122.3) $(181.2) $(98.5)
$(19.7)
$(35.2)
18View entire presentation