Solar Industry Update
Energy Storage Installed (MWh)
•
U.S. Energy Storage Installations by
Market Segment
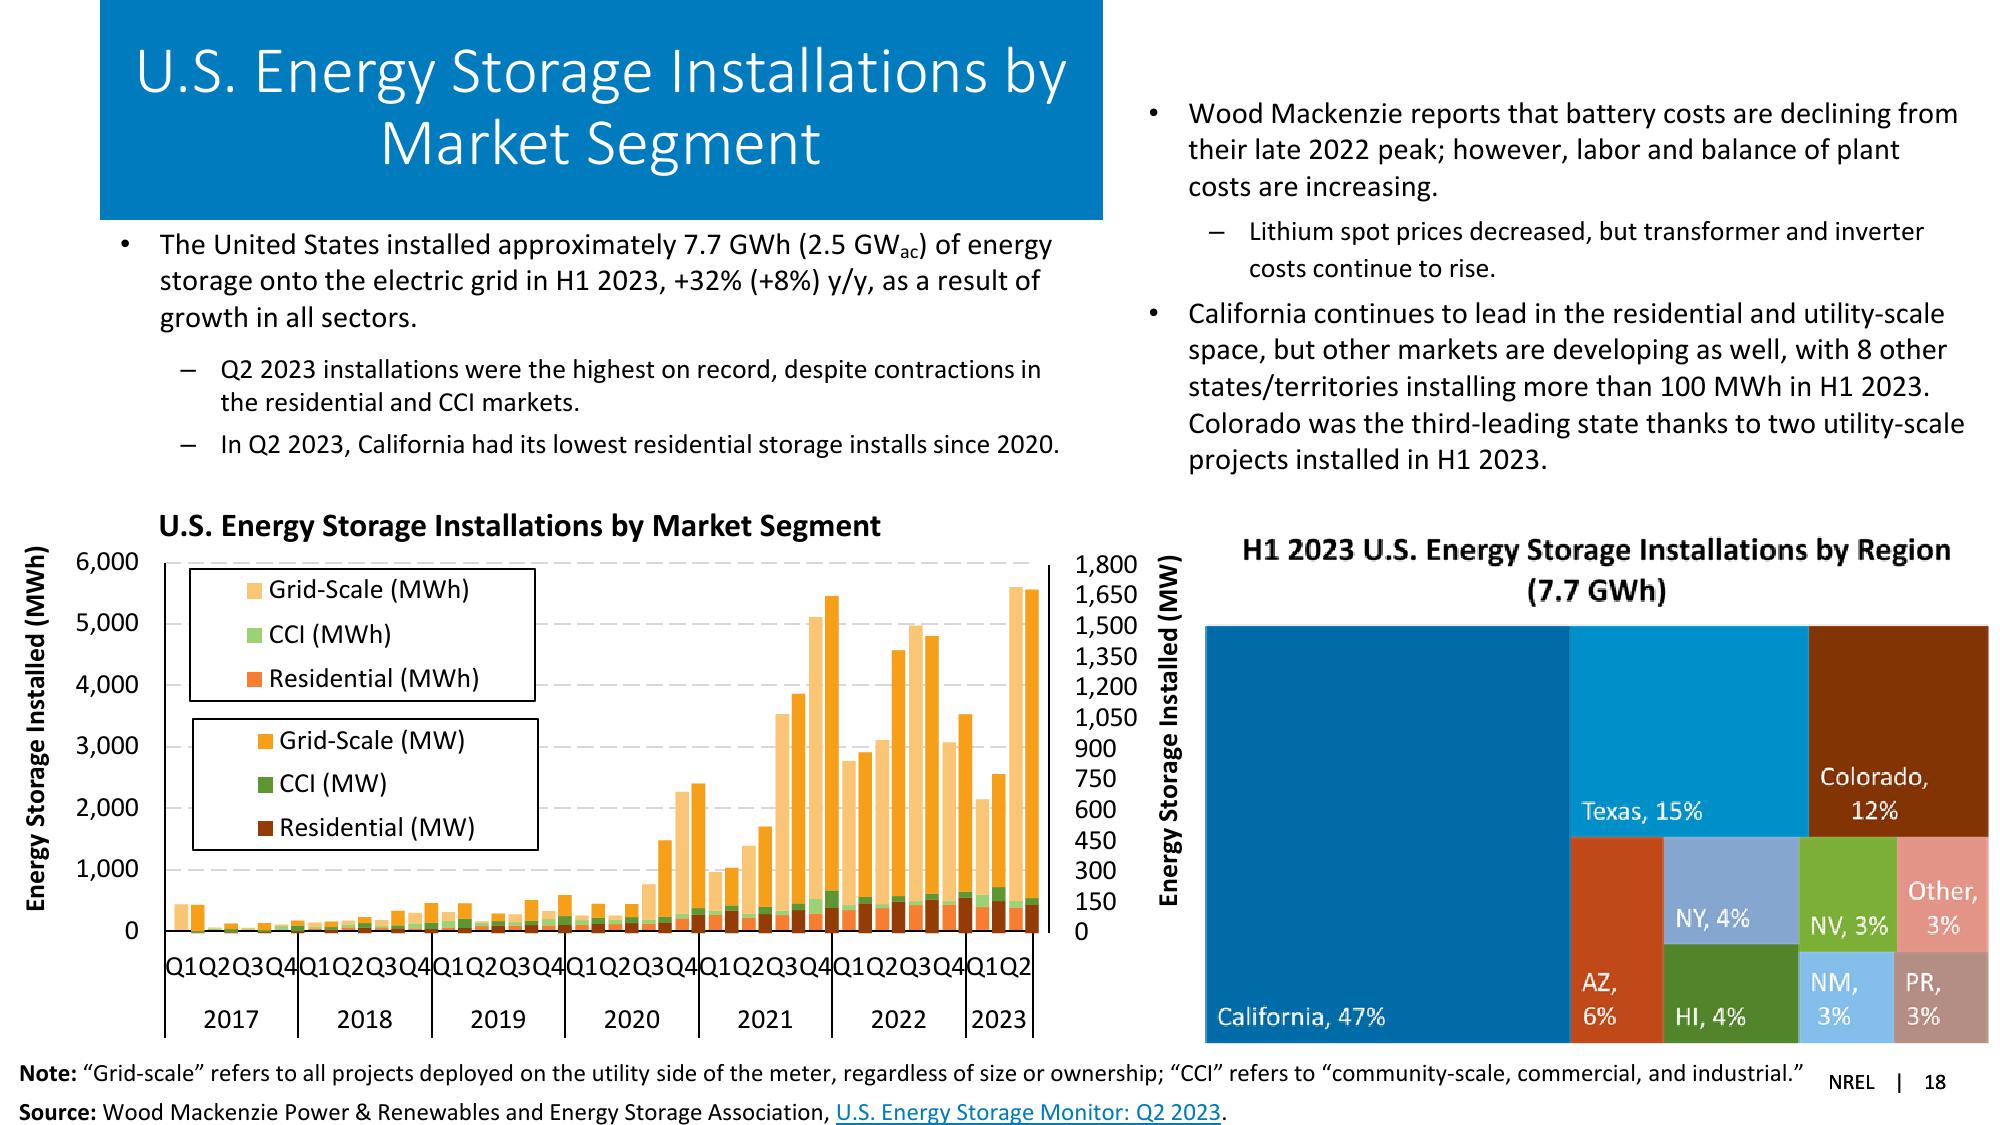
The United States installed approximately 7.7 GWh (2.5 GWac) of energy
storage onto the electric grid in H1 2023, +32% (+8%) y/y, as a result of
growth in all sectors.
-
-
Q2 2023 installations were the highest on record, despite contractions in
the residential and CCI markets.
In Q2 2023, California had its lowest residential storage installs since 2020.
Grid-Scale (MWh)
Wood Mackenzie reports that battery costs are declining from
their late 2022 peak; however, labor and balance of plant
costs are increasing.
Lithium spot prices decreased, but transformer and inverter
costs continue to rise.
California continues to lead in the residential and utility-scale
space, but other markets are developing as well, with 8 other
states/territories installing more than 100 MWh in H1 2023.
Colorado was the third-leading state thanks to two utility-scale
projects installed in H1 2023.
H1 2023 U.S. Energy Storage Installations by Region
(7.7 GWh)
U.S. Energy Storage Installations by Market Segment
6,000
5,000
■CCI (MWh)
4,000
■Residential (MWh)
3,000
■Grid-Scale (MW)
CCI (MW)
2,000
Residential (MW)
1,000
0
Q1Q2Q3Q4Q1Q2 Q3 Q4Q1 Q2 Q3 Q4Q1Q2 Q3 Q4Q1Q2 Q3 Q4Q1Q2 Q3 Q4Q1Q2
1,800
1,650
1,500
1,350
1,200
1,050
900
750
600
450
300
150
0
Energy Storage Installed (MW)
Texas, 15%
Colorado,
12%
2017
2018
2019
2020
2021
2022 2023
California, 47%
Note: "Grid-scale" refers to all projects deployed on the utility side of the meter, regardless of size or ownership; "CCI" refers to "community-scale, commercial, and industrial."
Source: Wood Mackenzie Power & Renewables and Energy Storage Association, U.S. Energy Storage Monitor: Q2 2023.
NREL 18
Other,
NY, 4%
NV, 3%
3%
AZ,
NM, PR,
6%
HI, 4%
3%
3%View entire presentation