Zegna Results Presentation Deck
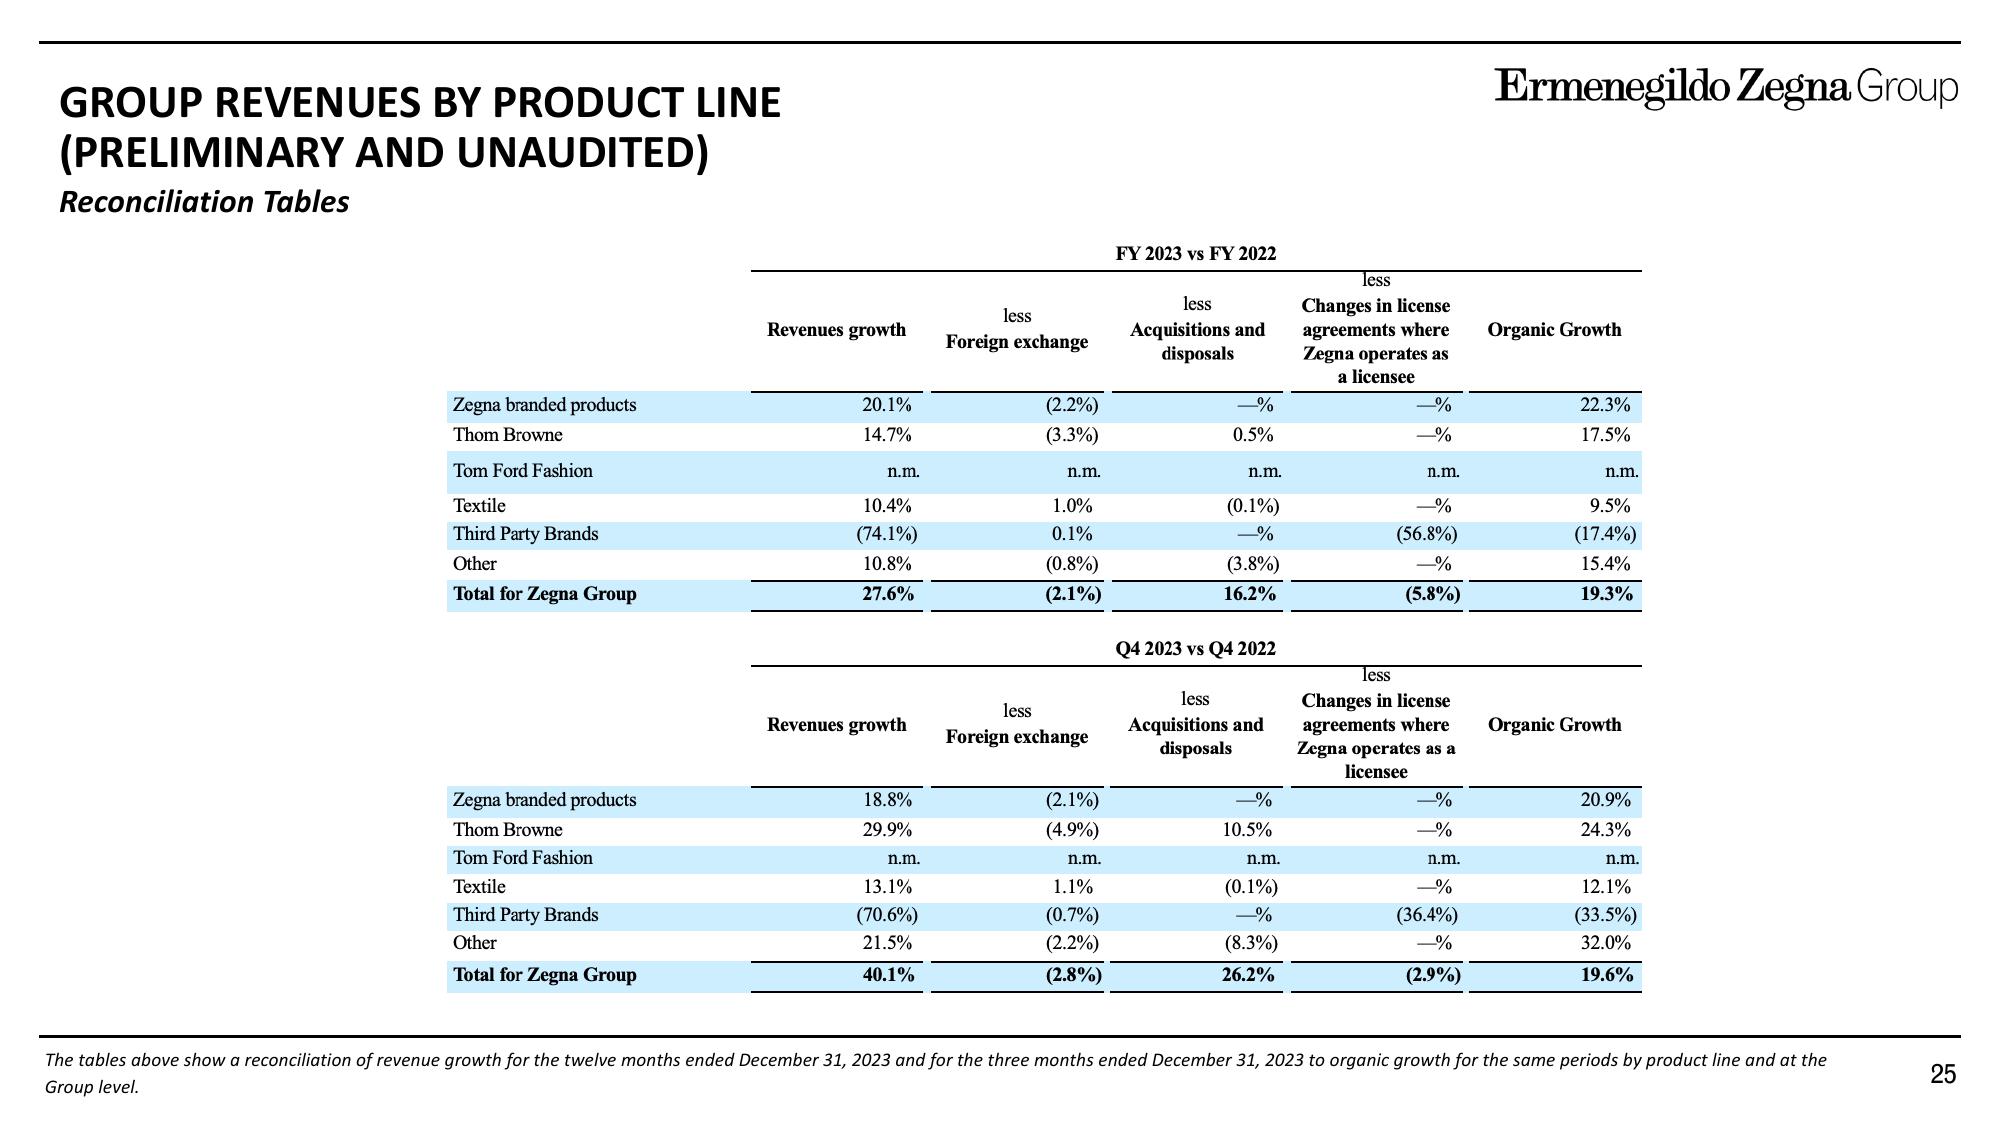
GROUP REVENUES BY PRODUCT LINE
(PRELIMINARY AND UNAUDITED)
Reconciliation Tables
Zegna branded products
Thom Browne
Tom Ford Fashion
Textile
Third Party Brands
Other
Total for Zegna Group
Zegna branded products
Thom Browne
Tom Ford Fashion
Textile
Third Party Brands
Other
Total for Zegna Group
Revenues growth
20.1%
14.7%
n.m.
10.4%
(74.1%)
10.8%
27.6%
Revenues growth
18.8%
29.9%
n.m.
13.1%
(70.6%)
21.5%
40.1%
less
Foreign exchange
less
(2.2%)
(3.3%)
n.m.
1.0%
0.1%
(0.8%)
(2.1%)
Foreign exchange
(2.1%)
(4.9%)
n.m.
1.1%
(0.7%)
(2.2%)
(2.8%)
FY 2023 vs FY 2022
less
Acquisitions and
disposals
-%
0.5%
n.m.
(0.1%)
-%
(3.8%)
16.2%
Q4 2023 vs Q4 2022
less
Acquisitions and
disposals
-%
10.5%
n.m.
(0.1%)
-%
(8.3%)
26.2%
less
Changes in license
agreements where
Zegna operates as
a licensee
-%
-%
n.m.
-%
(56.8%)
-%
(5.8%)
less
Changes in license
agreements where
Zegna operates as a
licensee
-%
-%
n.m.
-%
(36.4%)
-%
(2.9%)
Ermenegildo Zegna Group
Organic Growth
22.3%
17.5%
n.m.
9.5%
(17.4%)
15.4%
19.3%
Organic Growth
20.9%
24.3%
n.m.
12.1%
(33.5%)
32.0%
19.6%
The tables above show a reconciliation of revenue growth for the twelve months ended December 31, 2023 and for the three months ended December 31, 2023 to organic growth for the same periods by product line and at the
Group level.
25View entire presentation