CL King Best Ideas Conference
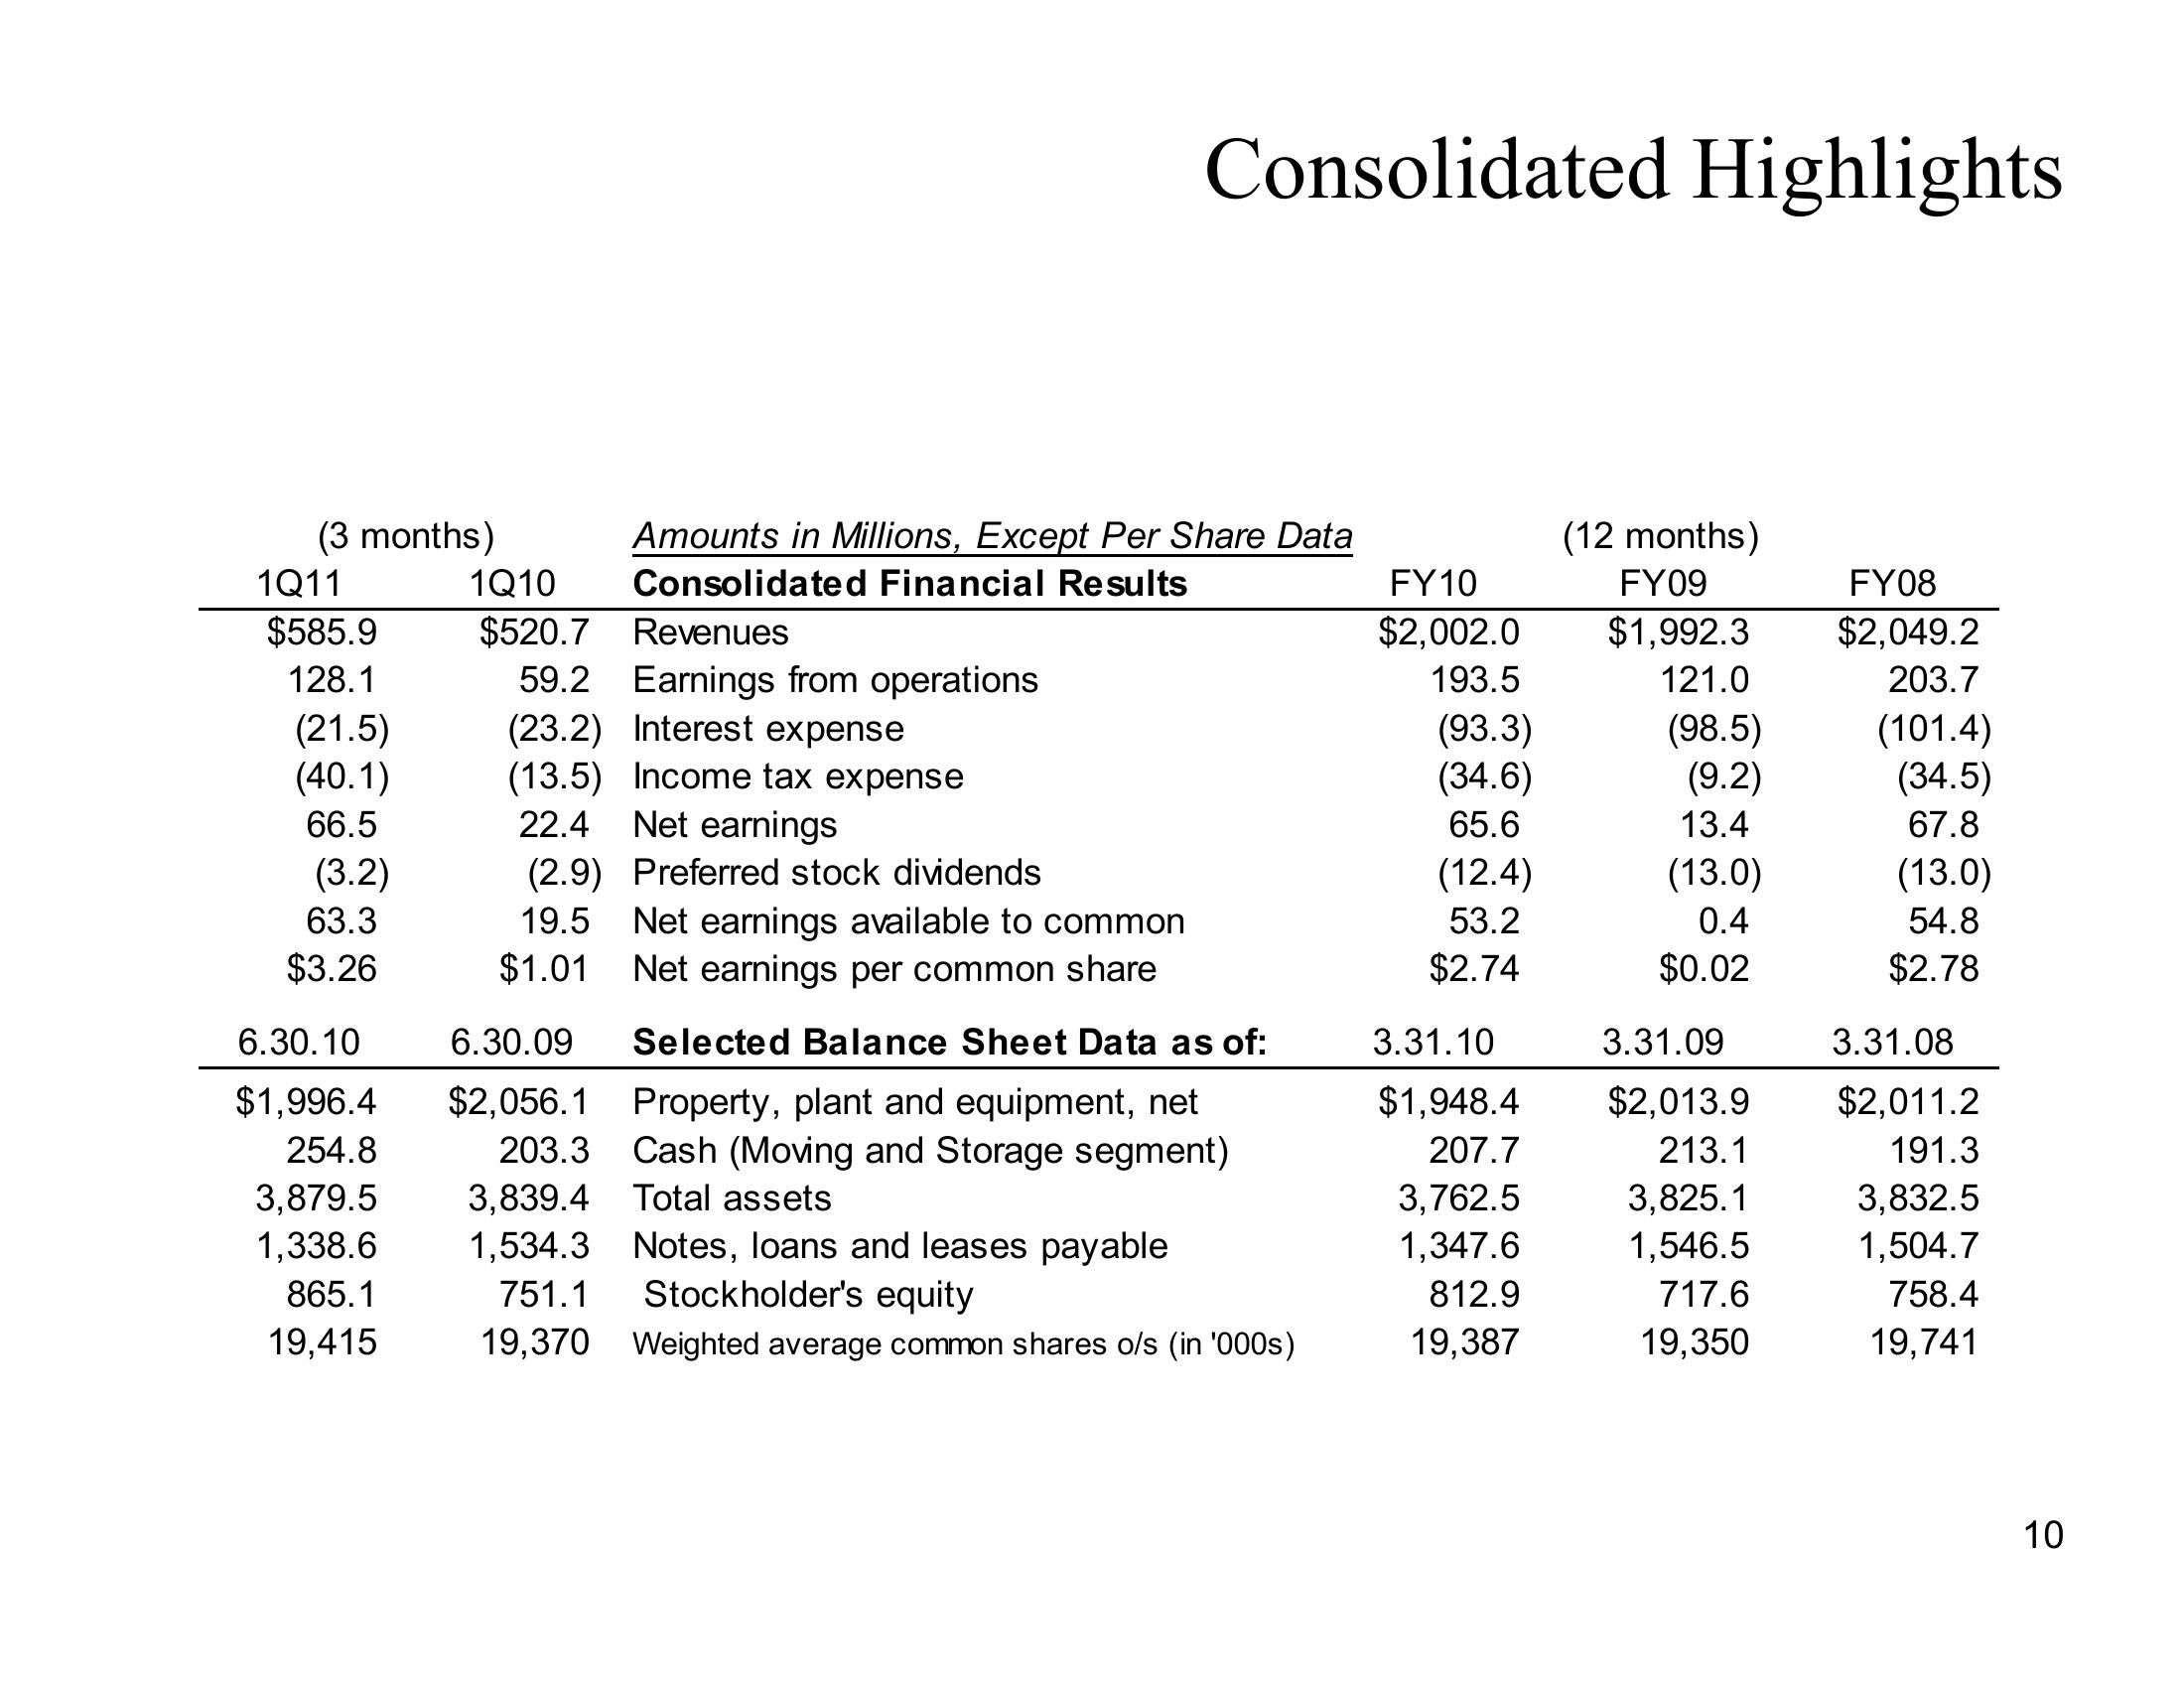
Consolidated Highlights
(3 months)
1Q11
$585.9
1Q10
$520.7
Amounts in Millions, Except Per Share Data
Consolidated Financial Results
FY10
Revenues
$2,002.0
(12 months)
FY09
$1,992.3
FY08
$2,049.2
128.1
59.2
Earnings from operations
193.5
121.0
203.7
(21.5)
(23.2)
Interest expense
(93.3)
(98.5)
(101.4)
(40.1)
(13.5)
Income tax expense
(34.6)
(9.2)
(34.5)
66.5
22.4
Net earnings
65.6
13.4
67.8
(3.2)
(2.9) Preferred stock dividends
(12.4)
(13.0)
(13.0)
63.3
19.5
$3.26
$1.01
6.30.10
6.30.09
Net earnings available to common
Net earnings per common share
Selected Balance Sheet Data as of:
53.2
0.4
54.8
$2.74
$0.02
$2.78
3.31.10
3.31.09
3.31.08
$1,996.4
254.8
3,879.5
1,338.6
865.1
19,415
$2,056.1 Property, plant and equipment, net
Cash (Moving and Storage segment)
$1,948.4
$2,013.9
$2,011.2
207.7
213.1
191.3
3,839.4
Total assets
3,762.5
3,825.1
3,832.5
1,534.3
751.1
Notes, loans and leases payable
Stockholder's equity
1,347.6
1,546.5
1,504.7
812.9
717.6
758.4
19,370
Weighted average common shares o/s (in '000s)
19,387
19,350
19,741
10View entire presentation