Marti Investor Presentation Deck
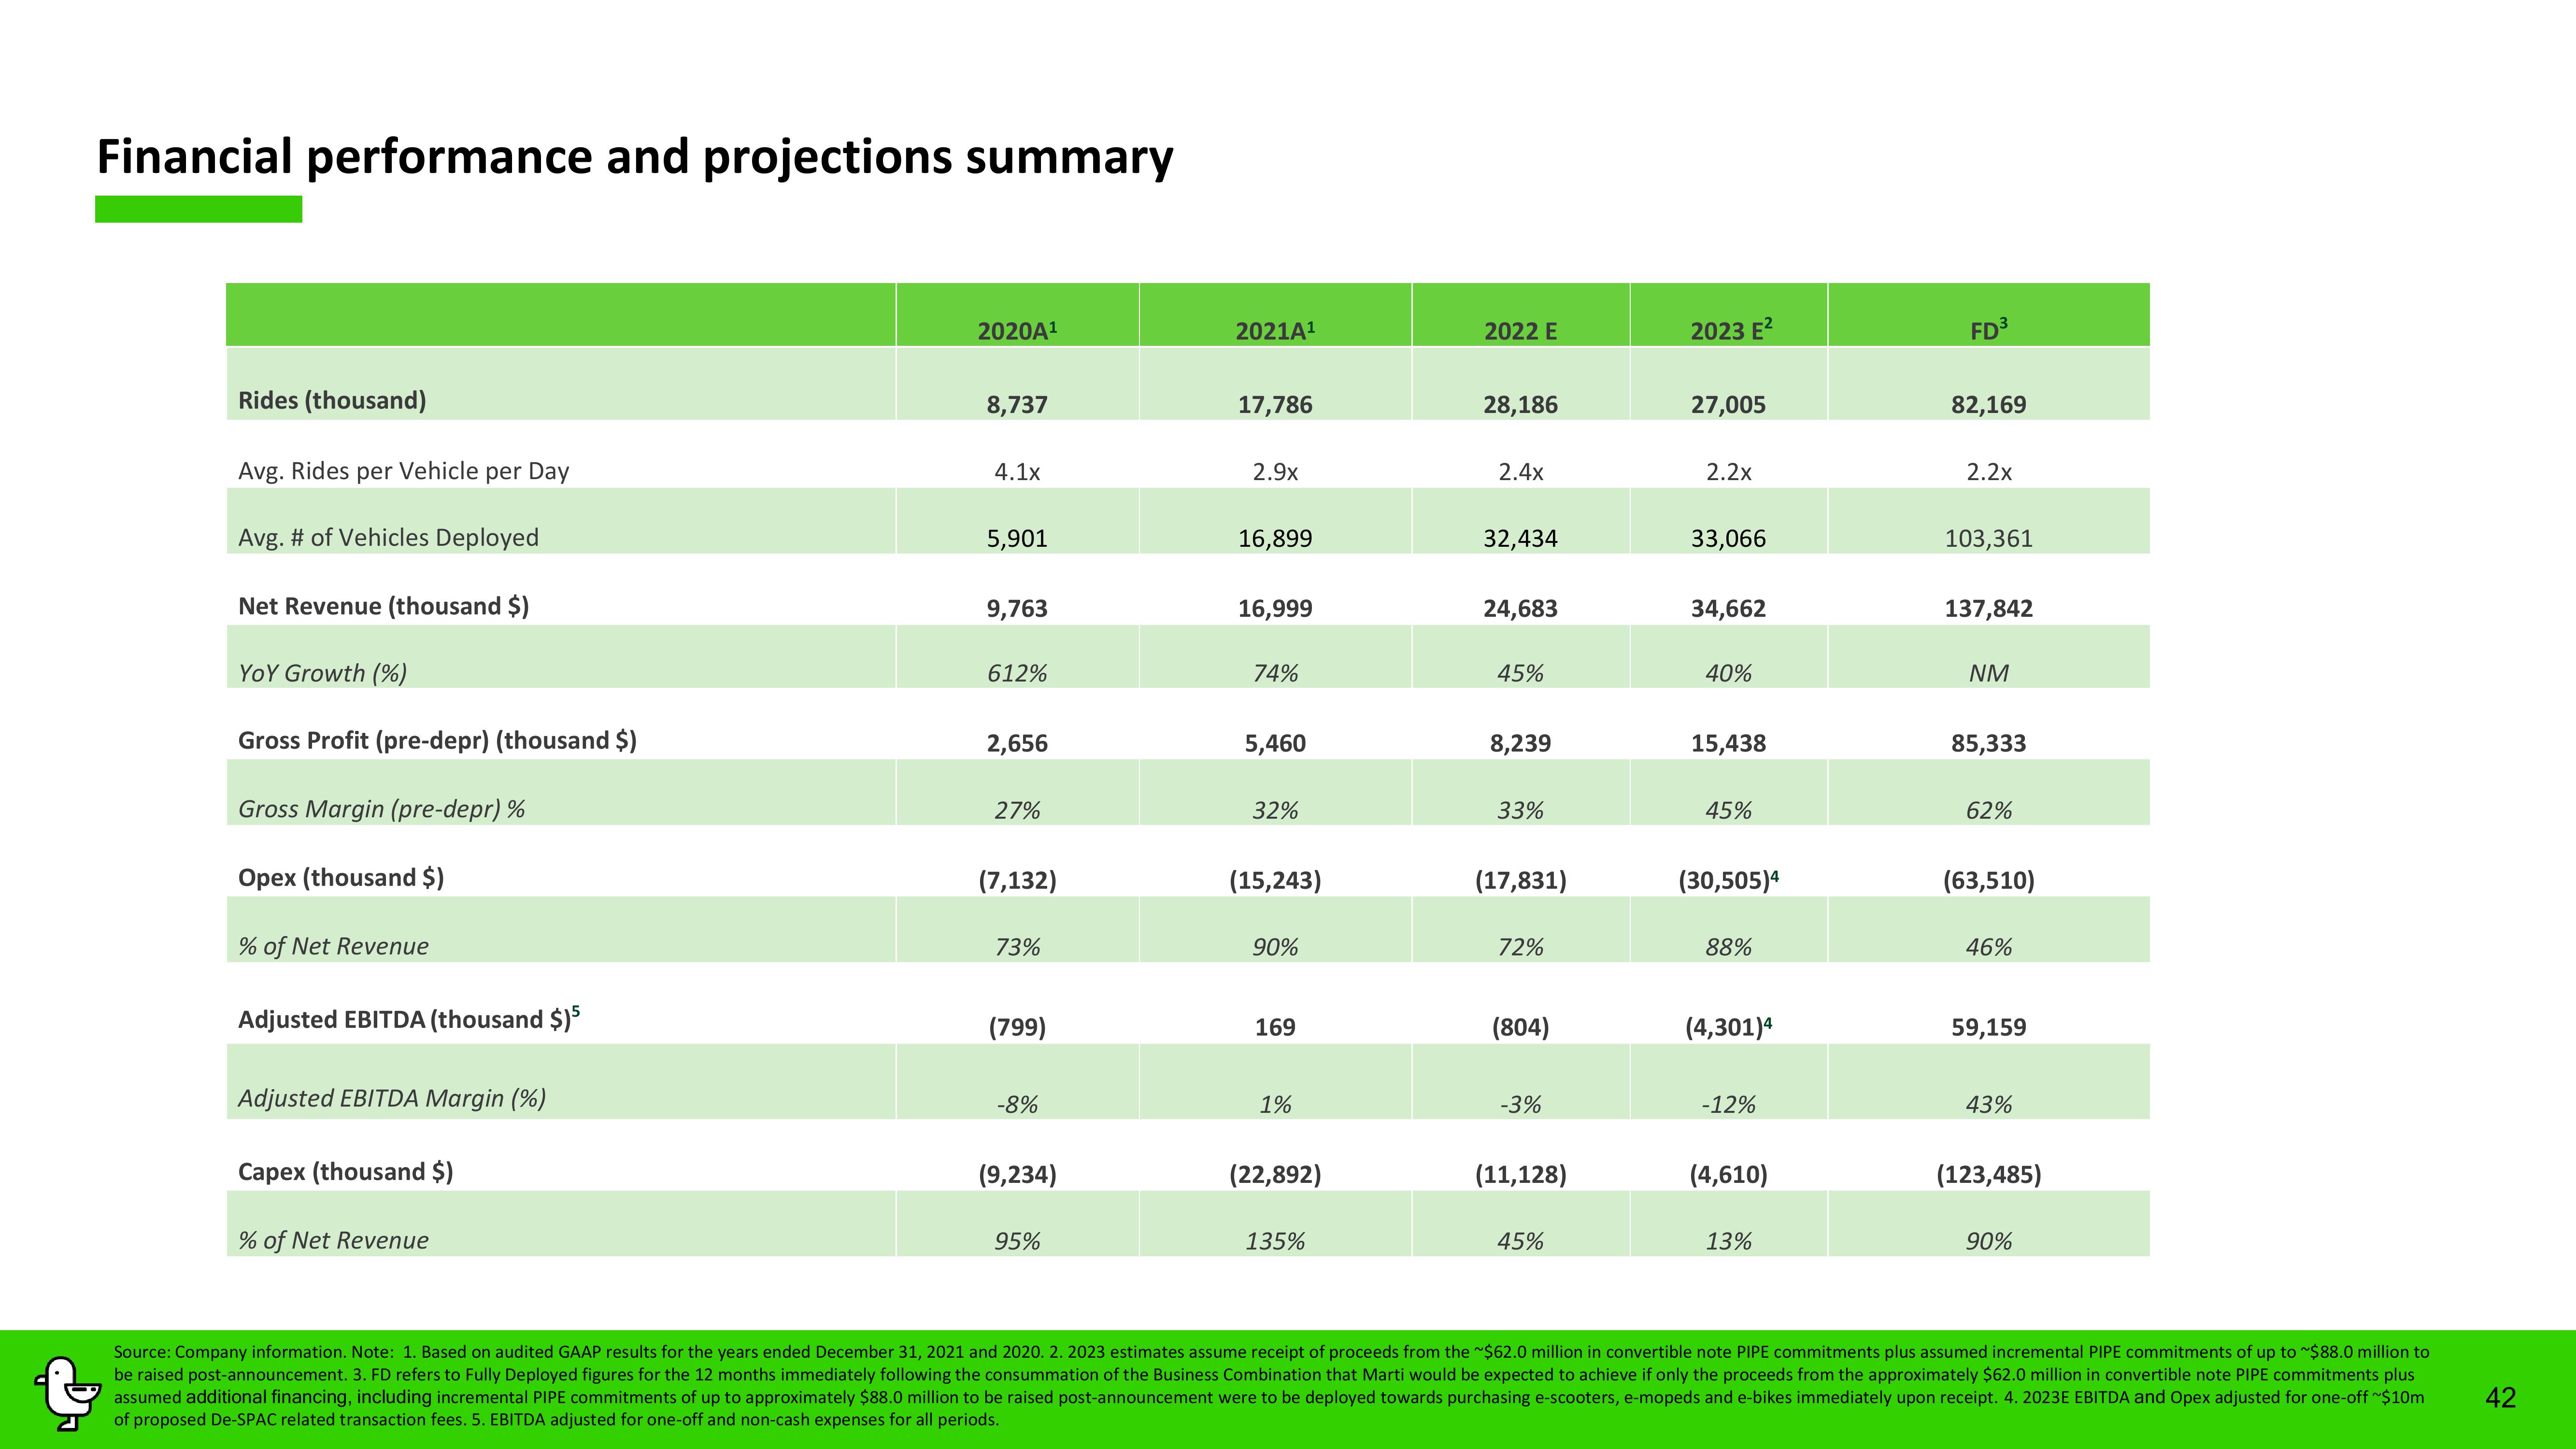
Financial performance and projections summary
Rides (thousand)
Avg. Rides per Vehicle per Day
Avg. # of Vehicles Deployed
Net Revenue (thousand $)
YOY Growth (%)
Gross Profit (pre-depr) (thousand $)
Gross Margin (pre-depr) %
Opex (thousand $)
% of Net Revenue
Adjusted EBITDA (thousand $)5
Adjusted EBITDA Margin (%)
Capex (thousand $)
% of Net Revenue
2020A¹
8,737
4.1x
5,901
9,763
612%
2,656
27%
(7,132)
73%
(799)
-8%
(9,234)
95%
2021A¹
17,786
2.9x
16,899
16,999
74%
5,460
32%
(15,243)
90%
169
1%
(22,892)
135%
2022 E
28,186
2.4x
32,434
24,683
45%
8,239
33%
(17,831)
72%
(804)
-3%
(11,128)
45%
2023 E²
27,005
2.2x
33,066
34,662
40%
15,438
45%
(30,505)4
88%
(4,301)4
-12%
(4,610)
13%
FD³
82,169
2.2x
103,361
137,842
NM
85,333
62%
(63,510)
46%
59,159
43%
(123,485)
90%
Source: Company information. Note: 1. Based on audited GAAP results for the years ended December 31, 2021 and 2020. 2. 2023 estimates assume receipt of proceeds from the ~$62.0 million in convertible note PIPE commitments plus assumed incremental PIPE commitments of up to $88.0 million to
be raised post-announcement. 3. FD refers to Fully Deployed figures for the 12 months immediately following the consummation of the Business Combination that Marti would be expected to achieve if only the proceeds from the approximately $62.0 million in convertible note PIPE commitments plus
assumed additional financing, including incremental PIPE commitments of up to approximately $88.0 million to be raised post-announcement were to be deployed towards purchasing e-scooters, e-mopeds and e-bikes immediately upon receipt. 4. 2023E EBITDA and Opex adjusted for one-off ~$10m
of proposed De-SPAC related transaction fees. 5. EBITDA adjusted for one-off and non-cash expenses for all periods.
42View entire presentation