Vivid Seats Investor Presentation Deck
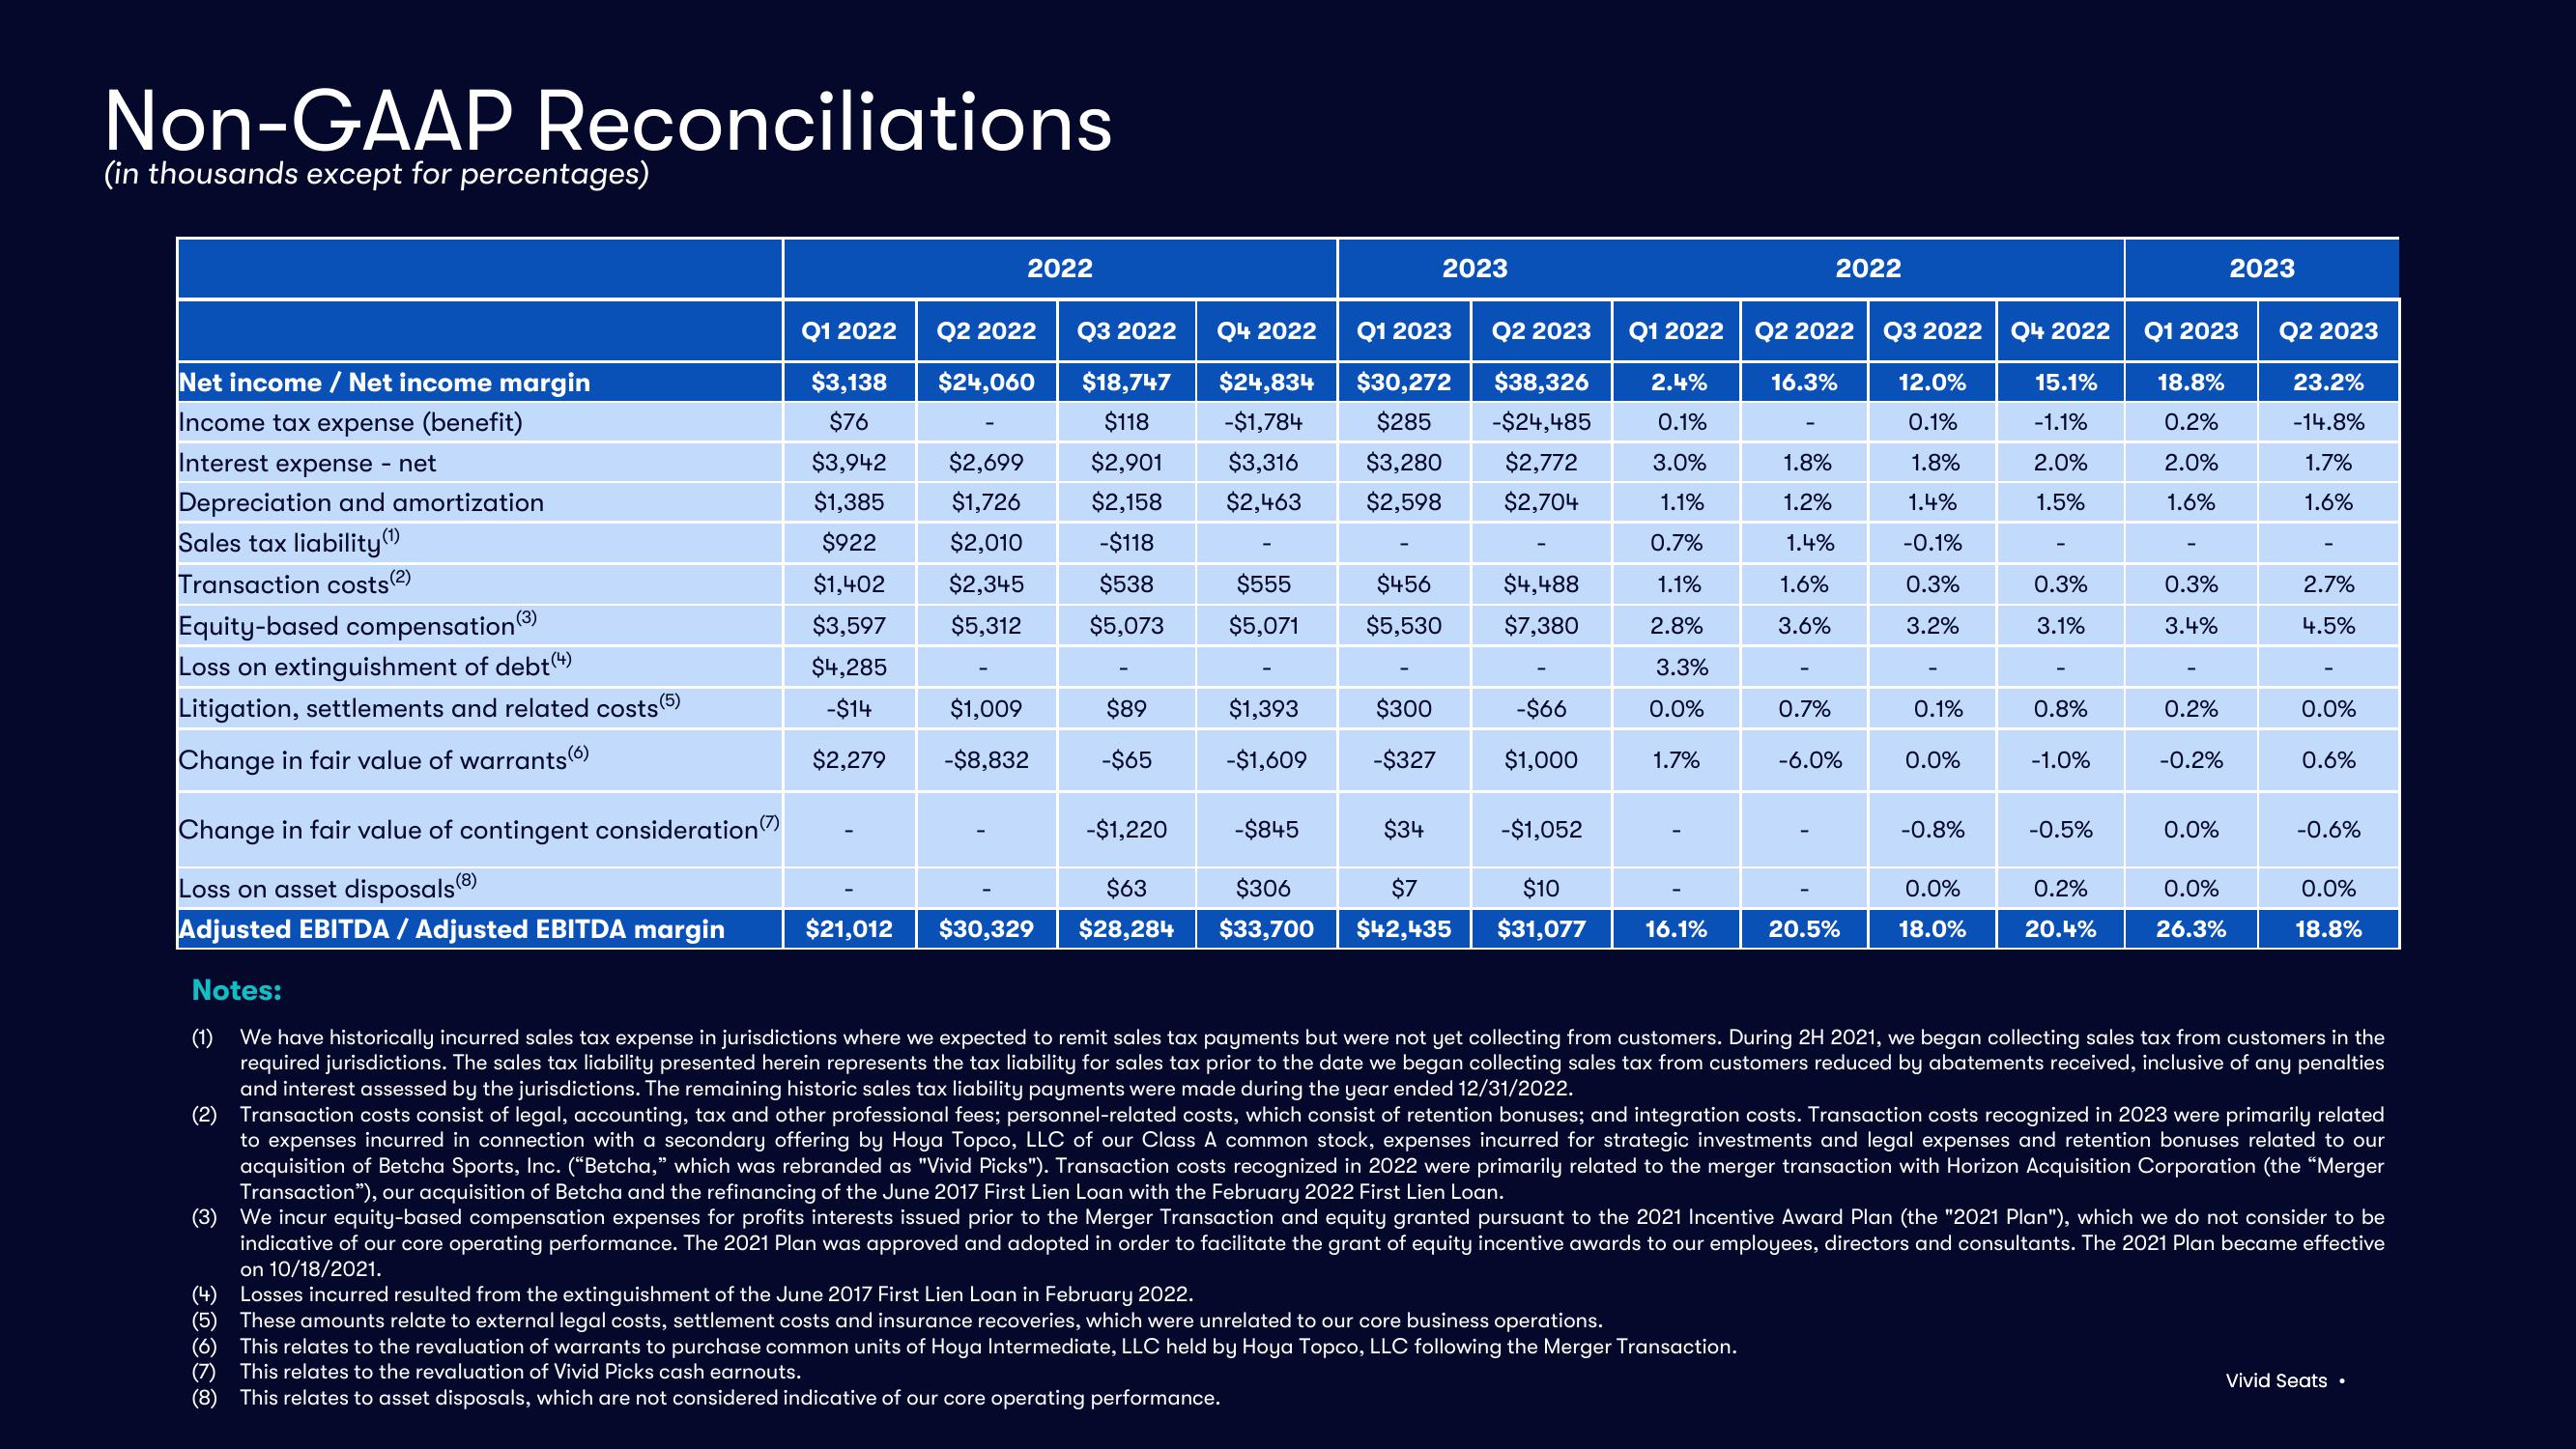
Non-GAAP Reconciliations
(in thousands except for percentages)
Net income / Net income margin
Income tax expense (benefit)
Interest expense - net
Depreciation and amortization
Sales tax liability (¹)
Transaction costs (2)
Equity-based compensation (3)
Loss on extinguishment of debt (4)
Litigation, settlements and related costs (5)
Change in fair value of warrants (6)
Q1 2022
$3,138
$76
$3,942
$1,385
$922
$1,402
$3,597
$4,285
-$14
$2,279
2022
Q2 2022
$24,060
$2,699
$1,726
$2,010
$2,345
$5,312
$1,009
-$8,832
Q3 2022
$18,747
$118
$2,901
$2,158
-$118
$538
$5,073
$89
-$65
-$1,220
$63
$21,012 $30,329 $28,284
Q4 2022
$24,834
-$1,784
$3,316
$2,463
$555
$5,071
$1,393
-$1,609
2023
Q1 2023
$30,272
$285
$3,280
$2,598
$456
$5,530
$300
-$327
Q2 2023
$38,326
-$24,485
$2,772
$2,704
-$845
$34
$306
$7
$33,700 $42,435
$4,488
$7,380
-$66
$1,000
Q1 2022
2.4%
0.1%
3.0%
1.1%
0.7%
1.1%
2.8%
3.3%
0.0%
1.7%
-$1,052
$10
$31,077 16.1%
This relates to the revaluation of warrants to purchase common units of Hoya Intermediate, LLC held by Hoya Topco, LLC following the Merger Transaction.
This relates to the revaluation of Vivid Picks cash earnouts.
(8) This relates to asset disposals, which are not considered indicative of our core operating performance.
Q2 2022 Q3 2022 Q4 2022
12.0%
0.1%
1.8%
1.4%
-0.1%
15.1%
-1.1%
2.0%
1.5%
0.3%
3.2%
16.3%
1.8%
1.2%
1.4%
2022
1.6%
3.6%
0.7%
-6.0%
0.1%
20.5%
0.0%
-0.8%
0.3%
3.1%
0.0%
18.0%
0.8%
-1.0%
-0.5%
Change in fair value of contingent consideration
Loss on asset disposals (8)
Adjusted EBITDA / Adjusted EBITDA margin
Notes:
(1)
We have historically incurred sales tax expense in jurisdictions where we expected to remit sales tax payments but were not yet collecting from customers. During 2H 2021, we began collecting sales tax from customers in the
required jurisdictions. The sales tax liability presented herein represents the tax liability for sales tax prior to the date we began collecting sales tax from customers reduced by abatements received, inclusive of any penalties
and interest assessed by the jurisdictions. The remaining historic sales tax liability payments were made during the year ended 12/31/2022.
(2) Transaction costs consist of legal, accounting, tax and other professional fees; personnel-related costs, which consist of retention bonuses; and integration costs. Transaction costs recognized in 2023 were primarily related
to expenses incurred in connection with a secondary offering by Hoya Topco, LLC of our Class A common stock, expenses incurred for strategic investments and legal expenses and retention bonuses related to our
acquisition of Betcha Sports, Inc. ("Betcha," which was rebranded as "Vivid Picks"). Transaction costs recognized in 2022 were primarily related to the merger transaction with Horizon Acquisition Corporation (the "Merger
Transaction"), our acquisition of Betcha and the refinancing of the June 2017 First Lien Loan with the February 2022 First Lien Loan.
(3) We incur equity-based compensation expenses for profits interests issued prior to the Merger Transaction and equity granted pursuant to the 2021 Incentive Award Plan (the "2021 Plan"), which we do not consider to be
ve of our core operating performance. The 2021 Plan was approved and adopted in order to acilitate the grant of equity incentive awards to our employees, directors and consultants. The 202 Plan became effective
on 10/18/2021.
(4) Losses incurred resulted from the extinguishment of the June 2017 First Lien Loan in February 2022.
(5) These amounts relate to external legal costs, settlement costs and insurance recoveries, which were unrelated to our core business operations.
(6)
0.2%
20.4%
Q1 2023
18.8%
0.2%
2.0%
1.6%
0.3%
3.4%
0.2%
-0.2%
2023
0.0%
0.0%
26.3%
Q2 2023
23.2%
-14.8%
1.7%
1.6%
2.7%
4.5%
0.0%
0.6%
-0.6%
0.0%
18.8%
Vivid Seats .View entire presentation