Kinnevik Results Presentation Deck
Intro
Net Asset Value
VIRTUAL CARE
Our Virtual Care businesses deliver specialized care services through
virtual channels, and leverage technology such as Al to improve the
care outcomes for their users. Our previous investee company Livongo
pioneered the model, and our current investee companies are disrupting
the virtual care incumbents such as Teladoc (TDOC) and Amwell (AMWL).
Our businesses are selling to employers and insurers and have a high
share of recurring revenues, but as healthcare companies they require
higher costs for servicing the end-user of their products than business
software may do. The appropriate public market benchmark for valuing
our virtual care businesses is therefore high-growth SaaS businesses and
healthcare technology businesses that share our investments' structurally
lower gross margins in the 50-70 percent area.
In the second quarter, we acquired USD 100m in shares in Spring
Health in the wake of the funding round that was concluded in the
previous quarter at a USD 2.5bn post-money valuation. The secondary
acquisition was made at a 25 percent discount to the USD 2.5bn valua-
tion the round was concluded at, which we hold as the fair intrinsic value
of the company. This underlying USD 2.5bn valuation of the business
corresponds to last quarter's valuation. As a consequence, the quarter's
write-up solely stems from a revaluing effect on our USD 100m investment
and a weakening Swedish krona. Spring Health has grown its revenues
since our late 2021 investment by more than 4x on an NTM basis and
more than 7x on an LTM basis. Meanwhile, during the same period, our
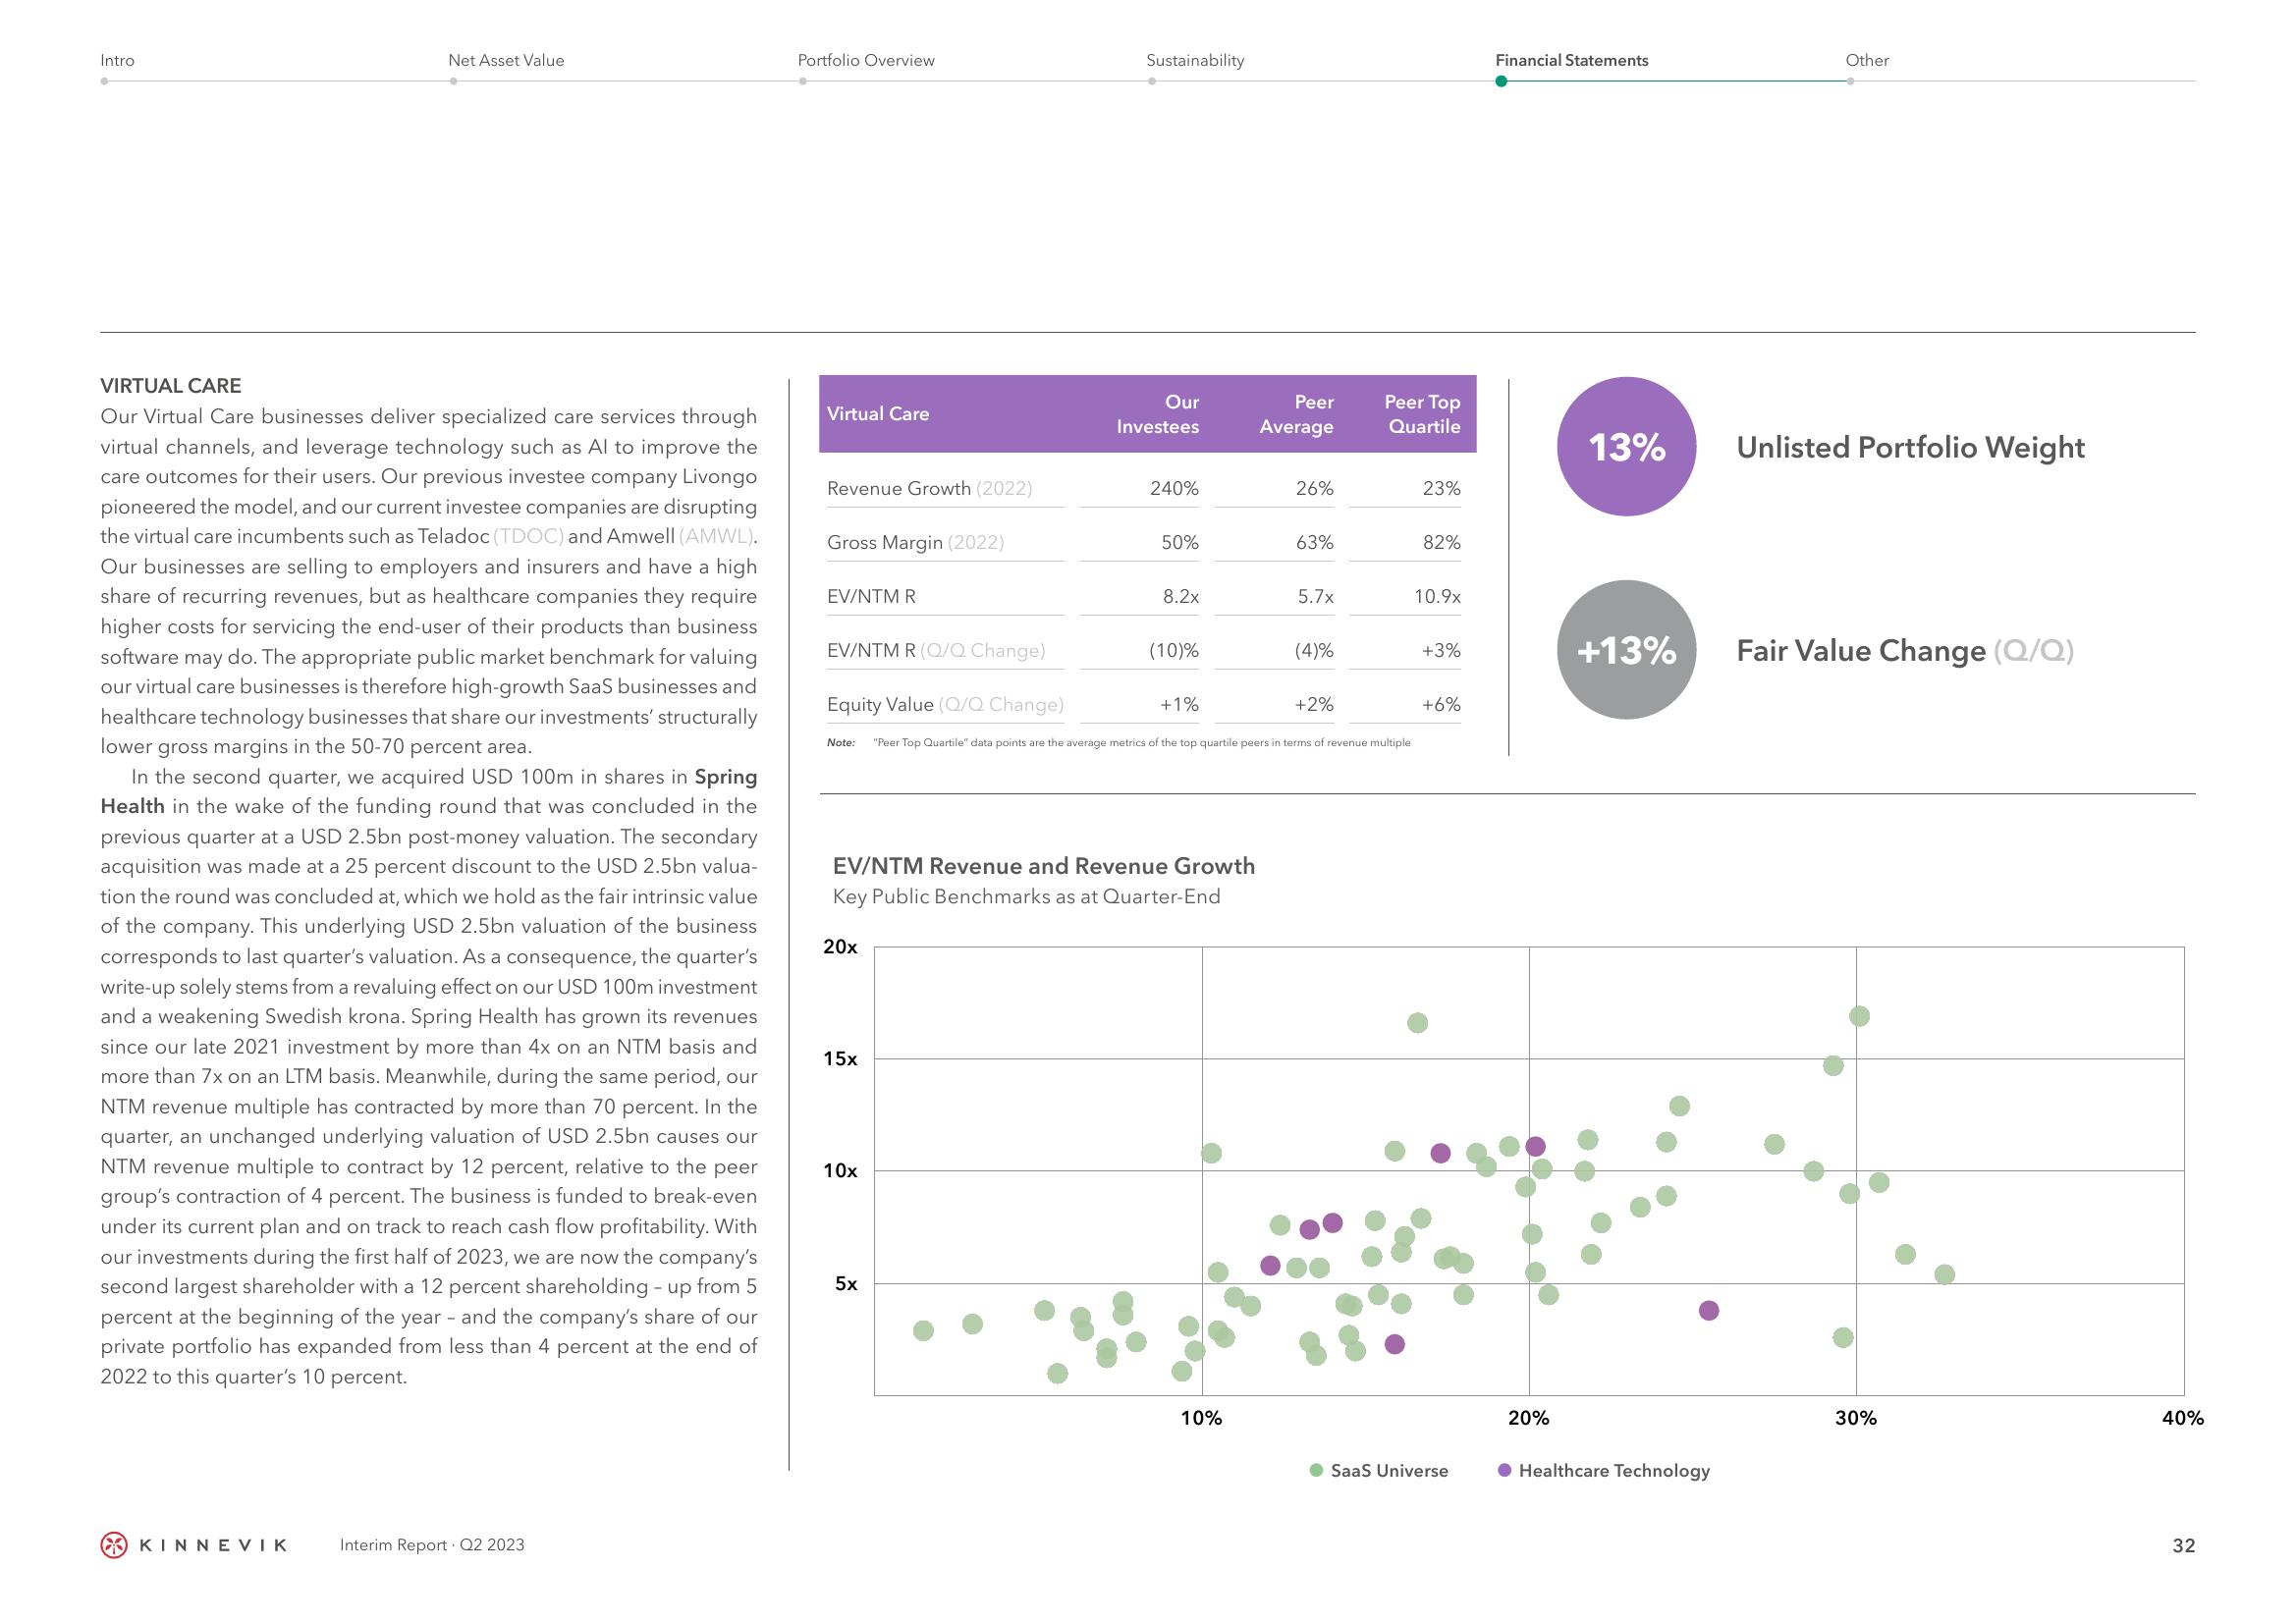
NTM revenue multiple has contracted by more than 70 percent. In the
quarter, an unchanged underlying valuation of USD 2.5bn causes our
NTM revenue multiple to contract by 12 percent, relative to the peer
group's contraction of 4 percent. The business is funded to break-even
under its current plan and on track to reach cash flow profitability. With
our investments during the first half of 2023, we are now the company's
second largest shareholder with a 12 percent shareholding - up from 5
percent at the beginning of the year - and the company's share of our
private portfolio has expanded from less than 4 percent at the end of
2022 to this quarter's 10 percent.
KINNEVIK
Interim Report Q2 2023
Portfolio Overview
Virtual Care
Revenue Growth (2022)
Gross Margin (2022)
EV/NTM R
EV/NTM R (Q/Q Change)
Equity Value (Q/Q Change)
Note:
20x
15x
10x
Sustainability
5x
Our
Investees
240%
50%
8.2x
EV/NTM Revenue and Revenue Growth
Key Public Benchmarks as at Quarter-End
(10)%
+1%
Peer
Average
10%
26%
63%
5.7x
(4)%
+2%
"Peer Top Quartile" data points are the average metrics of the top quartile peers in terms of revenue multiple
Peer Top
Quartile
23%
82%
10.9x
+3%
+6%
SaaS Universe
Financial Statements
20%
13%
+13%
Healthcare Technology
Other
Unlisted Portfolio Weight
Fair Value Change (Q/Q)
30%
40%
32View entire presentation