Udemy Results Presentation Deck
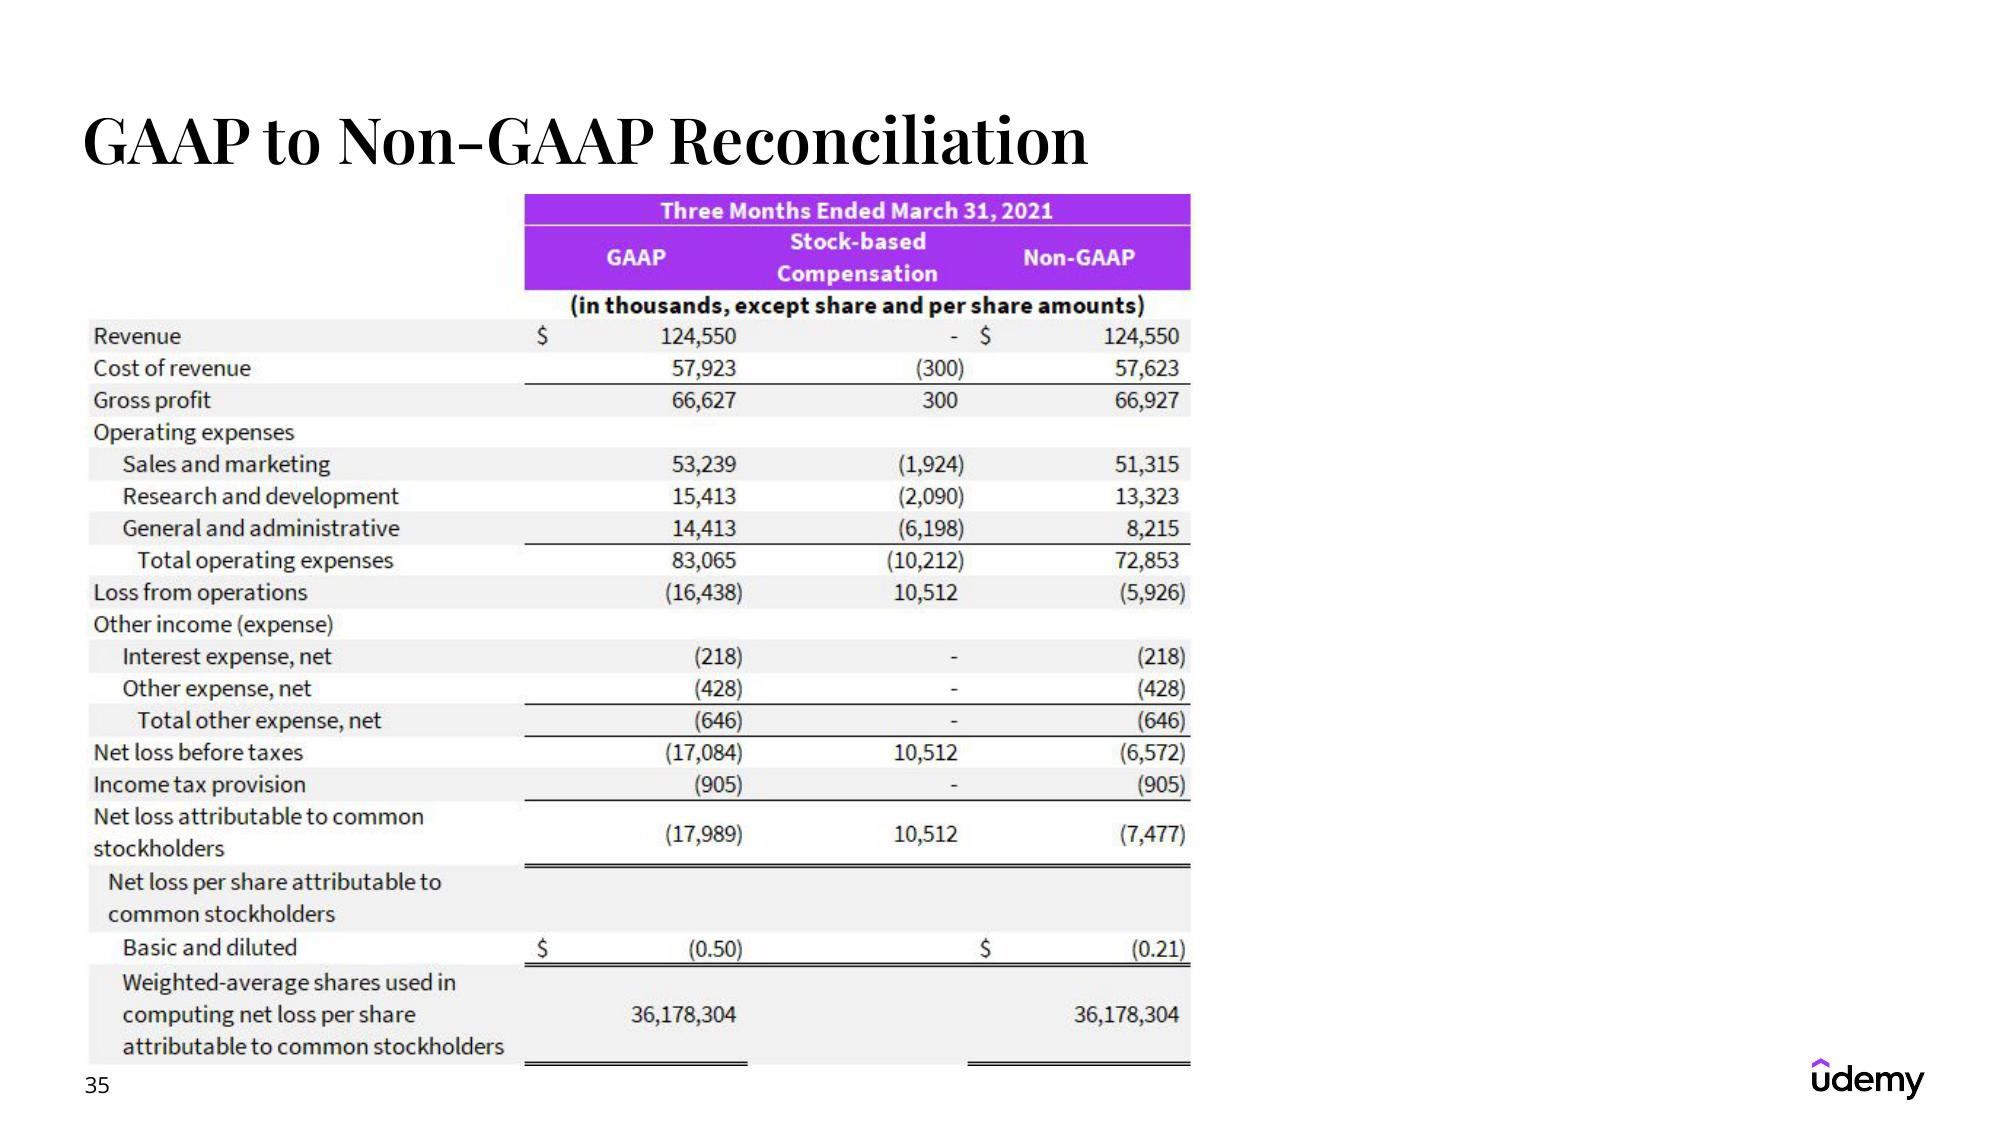
GAAP to Non-GAAP Reconciliation
Three Months Ended March 31, 2021
Stock-based
Compensation
Non-GAAP
(in thousands, except share and per share amounts)
$
$
Revenue
Cost of revenue
Gross profit
Operating expenses
Sales and marketing
Research and development
General and administrative
Total operating expenses
Loss from operations
Other income (expense)
Interest expense, net
Other expense, net
Total other expense, net
Net loss before taxes
Income tax provision
Net loss attributable to common
stockholders
35
Net loss per share attributable to
common stockholders
Basic and diluted
Weighted-average shares used in
computing net loss per share
attributable to common stockholders
$
GAAP
124,550
57,923
66,627
53,239
15,413
14,413
83,065
(16,438)
(218)
(428)
(646)
(17,084)
(905)
(17,989)
(0.50)
36,178,304
(300)
300
(1,924)
(2,090)
(6,198)
(10,212)
10,512
10,512
10,512
$
124,550
57,623
66,927
51,315
13,323
8,215
72,853
(5,926)
(218)
(428)
(646)
(6,572)
(905)
(7,477)
(0.21)
36,178,304
ûdemyView entire presentation