J.P.Morgan 2Q23 Investor Results
JPMORGAN CHASE & CO.
COMMERCIAL BANKING
FINANCIAL HIGHLIGHTS, CONTINUED
(in millions, except headcount and ratio data)
SELECTED BALANCE SHEET DATA (period-end)
Total assets
Loans:
Loans retained
Loans held-for-sale and loans at fair value
Total loans
Equity
Period-end loans by client segment
Middle Market Banking (a)
Corporate Client Banking
Commercial Real Estate Banking
Other
Total loans (a)
SELECTED BALANCE SHEET DATA (average)
Total assets
Loans:
Loans retained
Loans held-for-sale and loans at fair value
Total loans
Client deposits and other third-party liabilities
Equity
Average loans by client segment
Middle Market Banking
Corporate Client Banking
Commercial Real Estate Banking
Other
Total loans
Headcount
CREDIT DATA AND QUALITY STATISTICS
Net charge-offs/(recoveries)
Nonperforming assets
Nonaccrual loans:
Nonaccrual loans retained (b)
Nonaccrual loans held-for-sale and loans
at fair value
Total nonaccrual loans
Assets acquired in loan satisfactions
Total nonperforming assets
Allowance for credit losses:
Allowance for loan losses
Allowance for lending-related commitments
Total allowance for credit losses
Net charge-off/(recovery) rate (c)
Allowance for loan losses to period-end loans retained
Allowance for loan losses to nonaccrual loans retained (b)
Nonaccrual loans to period-end total loans
$
$
$
$
$
$
2Q23
$
305,280
282,124 (d)
1,540
283,664
30,000
79,885 (e)
60,511
142,897 (e)
371
283,664
290,875
270,091 (d)
726
270,817
275,223
29,505
100
1,068
1,068
78,037 (f) $
59,159
133,394 (f)
227
$ 270,817
15,991
1,068
4,729
801
5,530 (d)
$
0.15 %
1.68
443
0.38
$
$
$
$
$
$
$
1Q23
261,181
238,752
1,538
240,290
28,500
73,329
58,256
108,582
123
240,290
255,468
236,808
1,155
237,963
265,971
28,500
73,030
56,581
108,143
209
237,963
15,026
37
918
918
918
3,566
966
4,532
0.06
1.49
388
0.38
%
$
$
$
$
$
$
$
$
4Q22
QUARTERLY TRENDS
257,106
233,879
707
234,586
25,000
72,625
53,840
107,999
122
234,586
253,007
234,654
673
235,327
278,924
25,000
72,109
55,137
107,831
250
235,327
14,687
35
766
766
766
3,324
830
4,154
0.06
1.42
434
0.33
%
$
$
$
$
$
$
$
$
$
3Q22
247,485
231,829
137
231,966
25,000
71,707
52,940
107,241
78
231,966
246,318
227,539
1,589
229,128
281,336
25,000
70,002
52,432
106,546
148
229,128
14,299
42
836
836
7
843
3,050
864
3,914
0.07 %
1.32
365
0.36
$ 242,456
$
$
$
$
$
$
2Q22
$
223,541
566
224,107
25,000
68,535
49,503
105,982
87
224,107
239,381
218,478
1,004
219,482
300,425
25,000
66,640
47,832
104,890
120
219,482
13,811
1
761
761
8
769
2,602
725
3,327
1.16
342
0.34
%
2Q23 Change
1Q23
17%
18
18
5
9
32
202
18
14
14
(37)
14
3
4
7
5
23
9
14
6
170
16
- 16 - 16 33 (17) 22
JPMORGAN CHASE & Co.
SIX MONTHS ENDED JUNE 30,
2Q22
26 %
26
172
27
20
17
22
35
326
27
22
24
(28)
23
(8)
18
17
24
27
89
23
16
NM
40
40
NM
39
82
10
66
$
$
$
$
$
$
2023
305,280
$
282,124 (d)
1,540
283,664
30,000
273,269
$ 254,481
270,622
29,005
79,885 (e) $
60,511
142,897 (e)
371
283,664
253,542 (d)
939
75,547 (f)
57,877
120,838 (f)
219
$ 254,481
15,991
137
1,068
1,068
1,068
4,729
801
5,530 (d)
$
0.11 %
1.68
443
0.38
$
$
$
$
$
$
2022
242,456
223,541
566
224,107
25,000
68,535
49,503
105,982
87
224,107
236,444
213,536
1,572
215,108
308,627
25,000
64,550
46,720
103,701
137
215,108
13,811
7
761
761
8
769
2,602
725
3,327
0.01 %
1.16
342
0.34
2023 Change
2022
26%
26
172
27
20
17
22
35
326
27
16
19
(40)
18
(12)
16
17
24
17
60
18
16
NM
40
40
NM
39
82
10
66
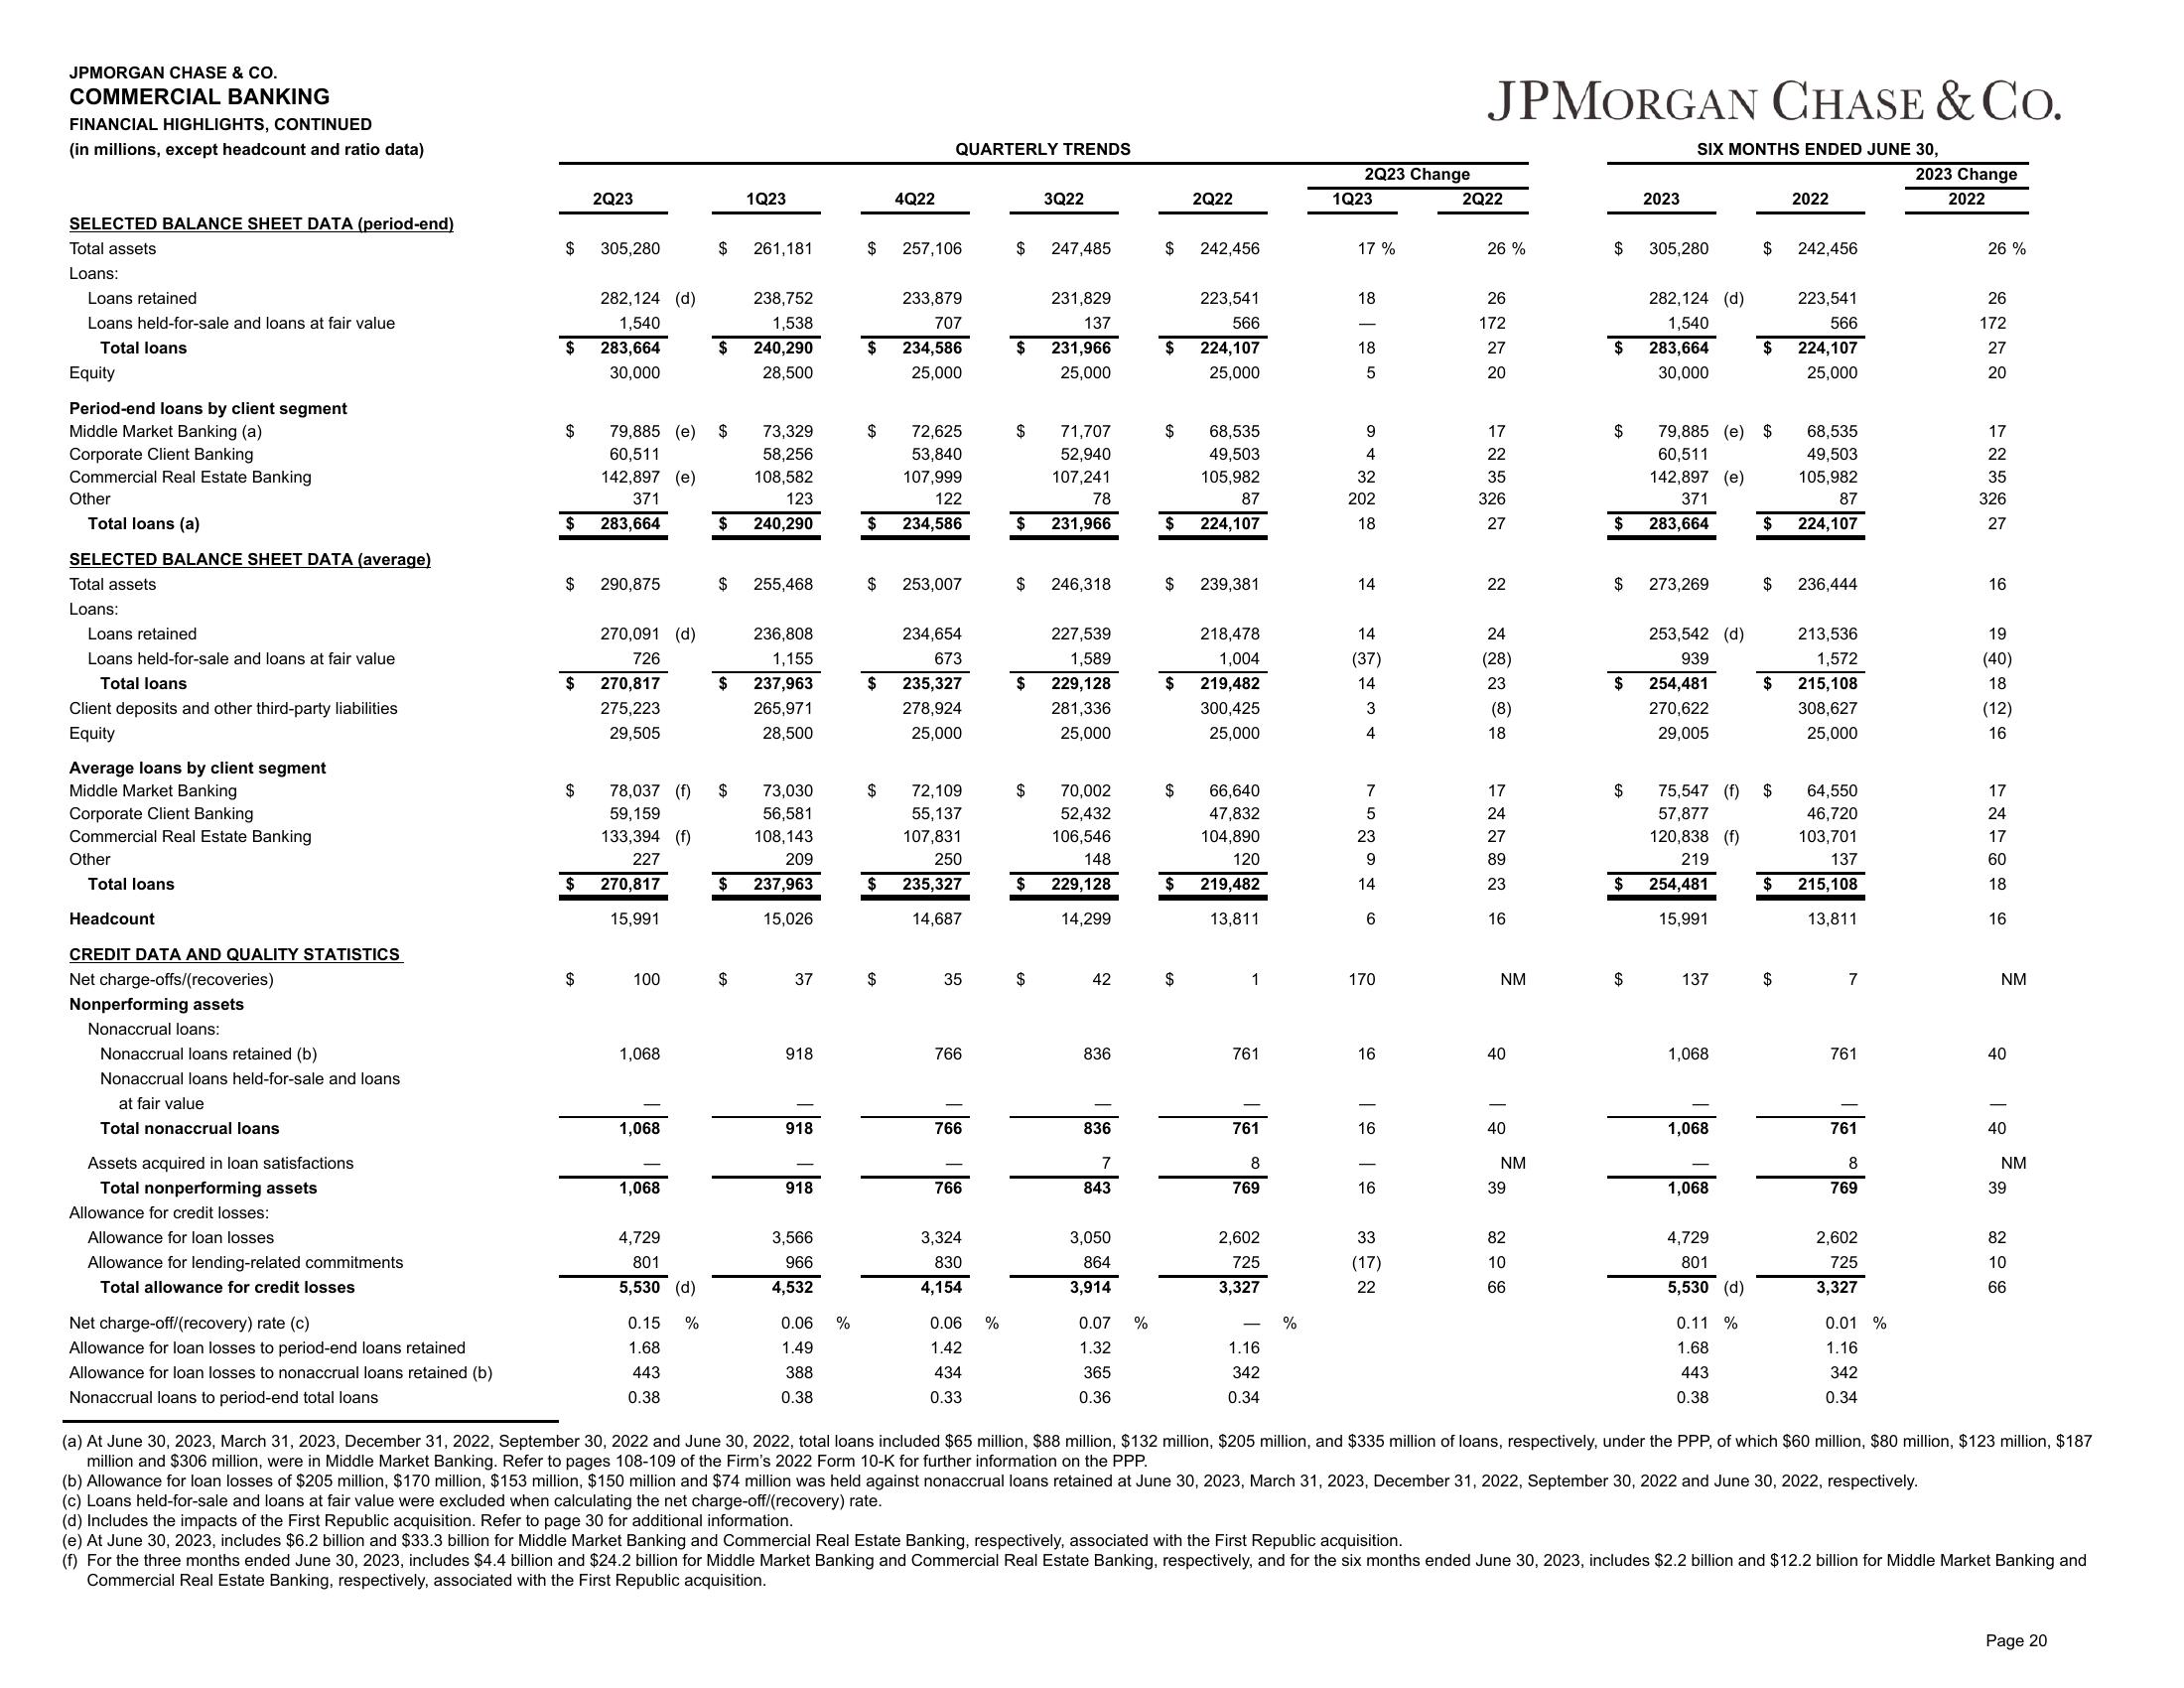
(a) At June 30, 2023, March 31, 2023, December 31, 2022, September 30, 2022 and June 30, 2022, total loans included $65 million, $88 million, $132 million, $205 million, and $335 million of loans, respectively, under the PPP, of which $60 million, $80 million, $123 million, $187
million and $306 million, were in Middle Market Banking. Refer to pages 108-109 of the Firm's 2022 Form 10-K for further information on the PPP.
(b) Allowance for loan losses of $205 million, $170 million, $153 million, $150 million and $74 million was held against nonaccrual loans retained at June 30, 2023, March 31, 2023, December 31, 2022, September 30, 2022 and June 30, 2022, respectively.
(c) Loans held-for-sale and loans at fair value were excluded when calculating the net charge-off/(recovery) rate.
(d) Includes the impacts of the First Republic acquisition. Refer to page 30 for additional information.
(e) At June 30, 2023, includes $6.2 billion and $33.3 billion for Middle Market Banking and Commercial Real Estate Banking, respectively, associated with the First Republic acquisition.
(f) For the three months ended June 30, 2023, includes $4.4 billion and $24.2 billion for Middle Market Banking and Commercial Real Estate Banking, respectively, and for the six months ended June 30, 2023, includes $2.2 billion and $12.2 billion for Middle Market Banking and
Commercial Real Estate Banking, respectively, associated with the First Republic acquisition.
Page 20View entire presentation