Sonos Results Presentation Deck
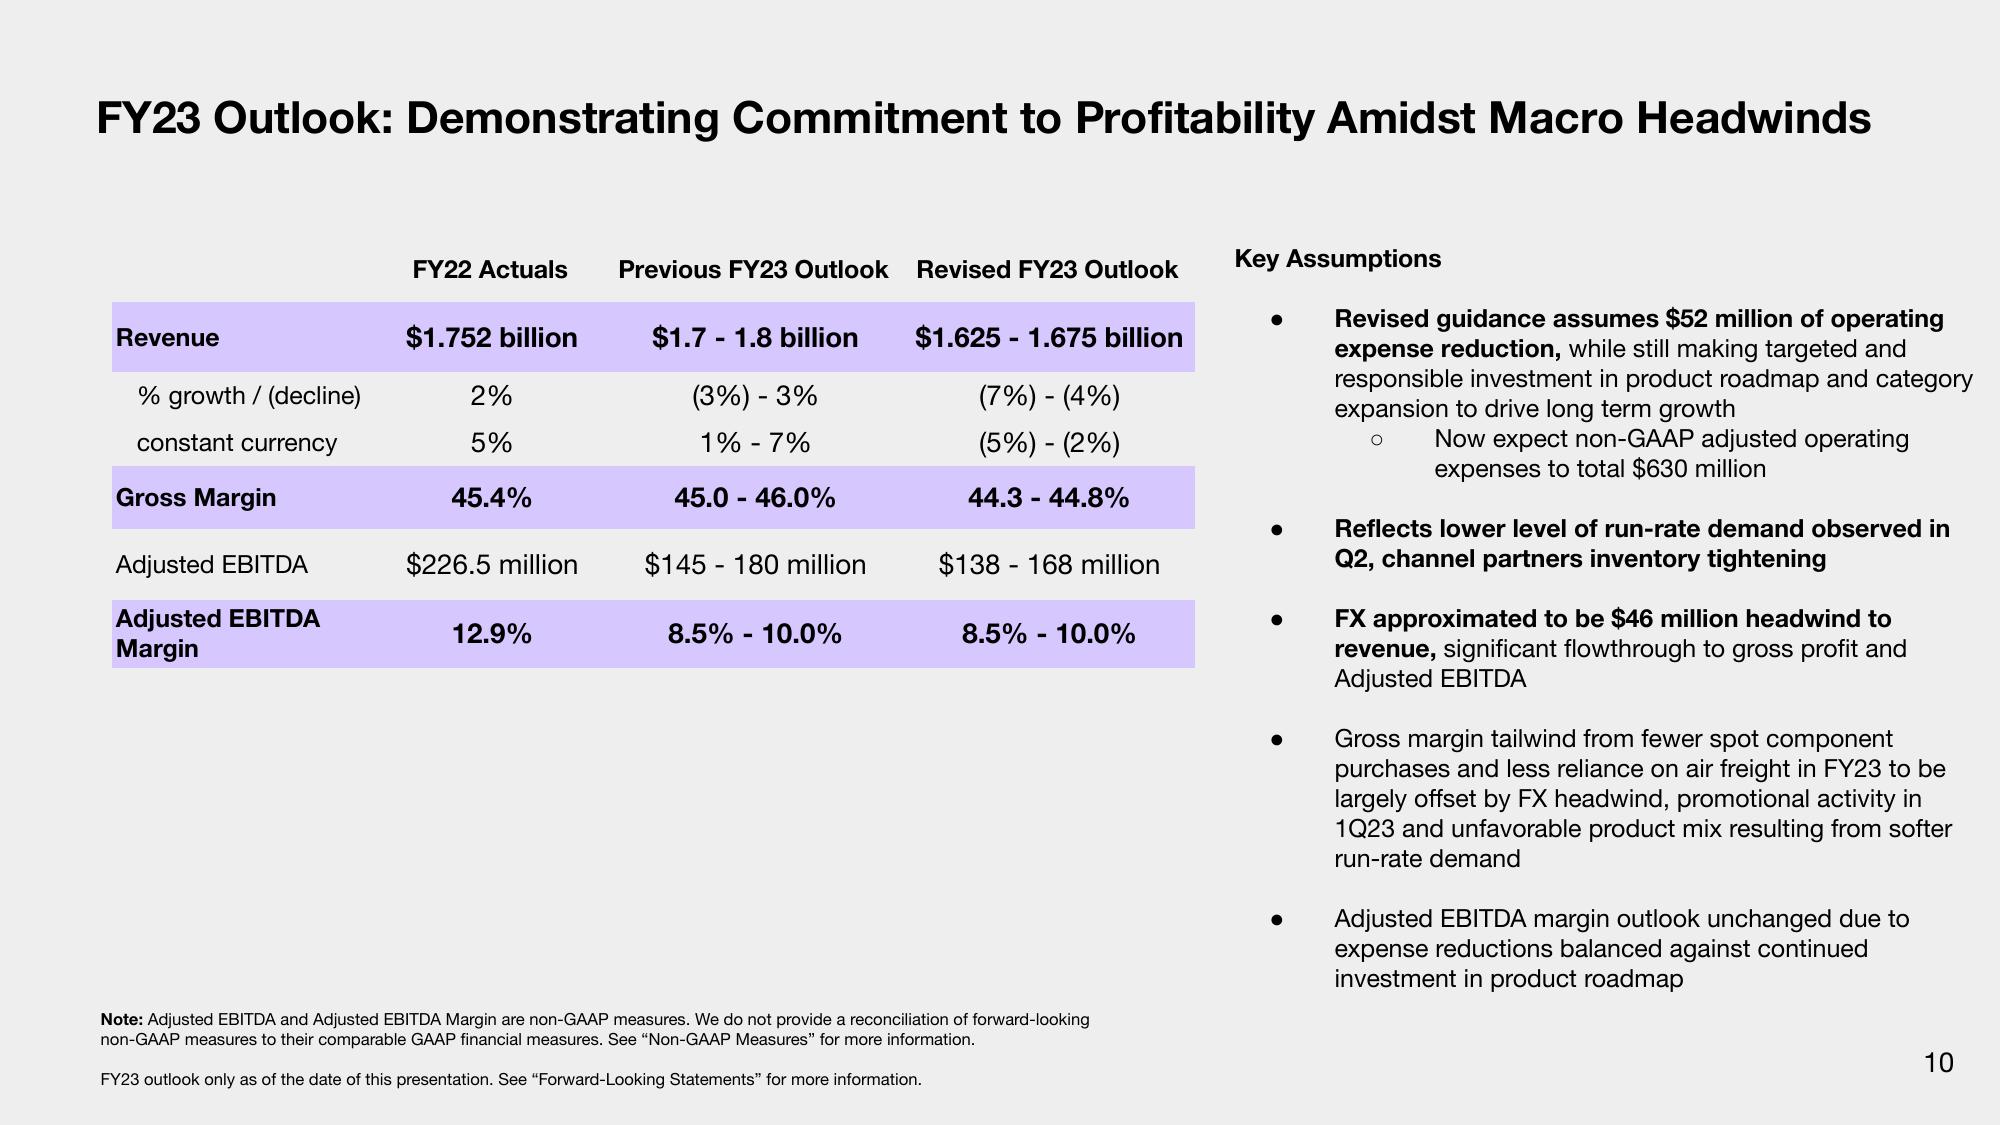
FY23 Outlook: Demonstrating Commitment to Profitability Amidst Macro Headwinds
Revenue
% growth / (decline)
constant currency
Gross Margin
Adjusted EBITDA
Adjusted EBITDA
Margin
FY22 Actuals Previous FY23 Outlook
$1.752 billion
2%
5%
45.4%
$226.5 million
12.9%
$1.7 1.8 billion
(3%) - 3%
1% - 7%
45.0 - 46.0%
$145 180 million
8.5% - 10.0%
Revised FY23 Outlook
$1.625 1.675 billion
(7%) - (4%)
(5%) - (2%)
44.3 - 44.8%
$138 168 million
8.5% - 10.0%
Note: Adjusted EBITDA and Adjusted EBITDA Margin are non-GAAP measures. We do not provide a reconciliation of forward-looking
non-GAAP measures to their comparable GAAP financial measures. See "Non-GAAP Measures" for more information.
FY23 outlook only as of the date of this presentation. See "Forward-Looking Statements" for more information.
Key Assumptions
Revised guidance assumes $52 million of operating
expense reduction, while still making targeted and
responsible investment in product roadmap and category
expansion to drive long term growth
Now expect non-GAAP adjusted operating
expenses to total $630 million
Reflects lower level of run-rate demand observed in
Q2, channel partners inventory tightening
FX approximated to be $46 million headwind to
revenue, significant flowthrough to gross profit and
Adjusted EBITDA
Gross margin tailwind from fewer spot component
purchases and less reliance on air freight in FY23 to be
largely offset by FX headwind, promotional activity in
1Q23 and unfavorable product mix resulting from softer
run-rate demand
Adjusted EBITDA margin outlook unchanged due to
expense reductions balanced against continued
investment in product roadmap
10View entire presentation