OpenText Investor Day Presentation Deck
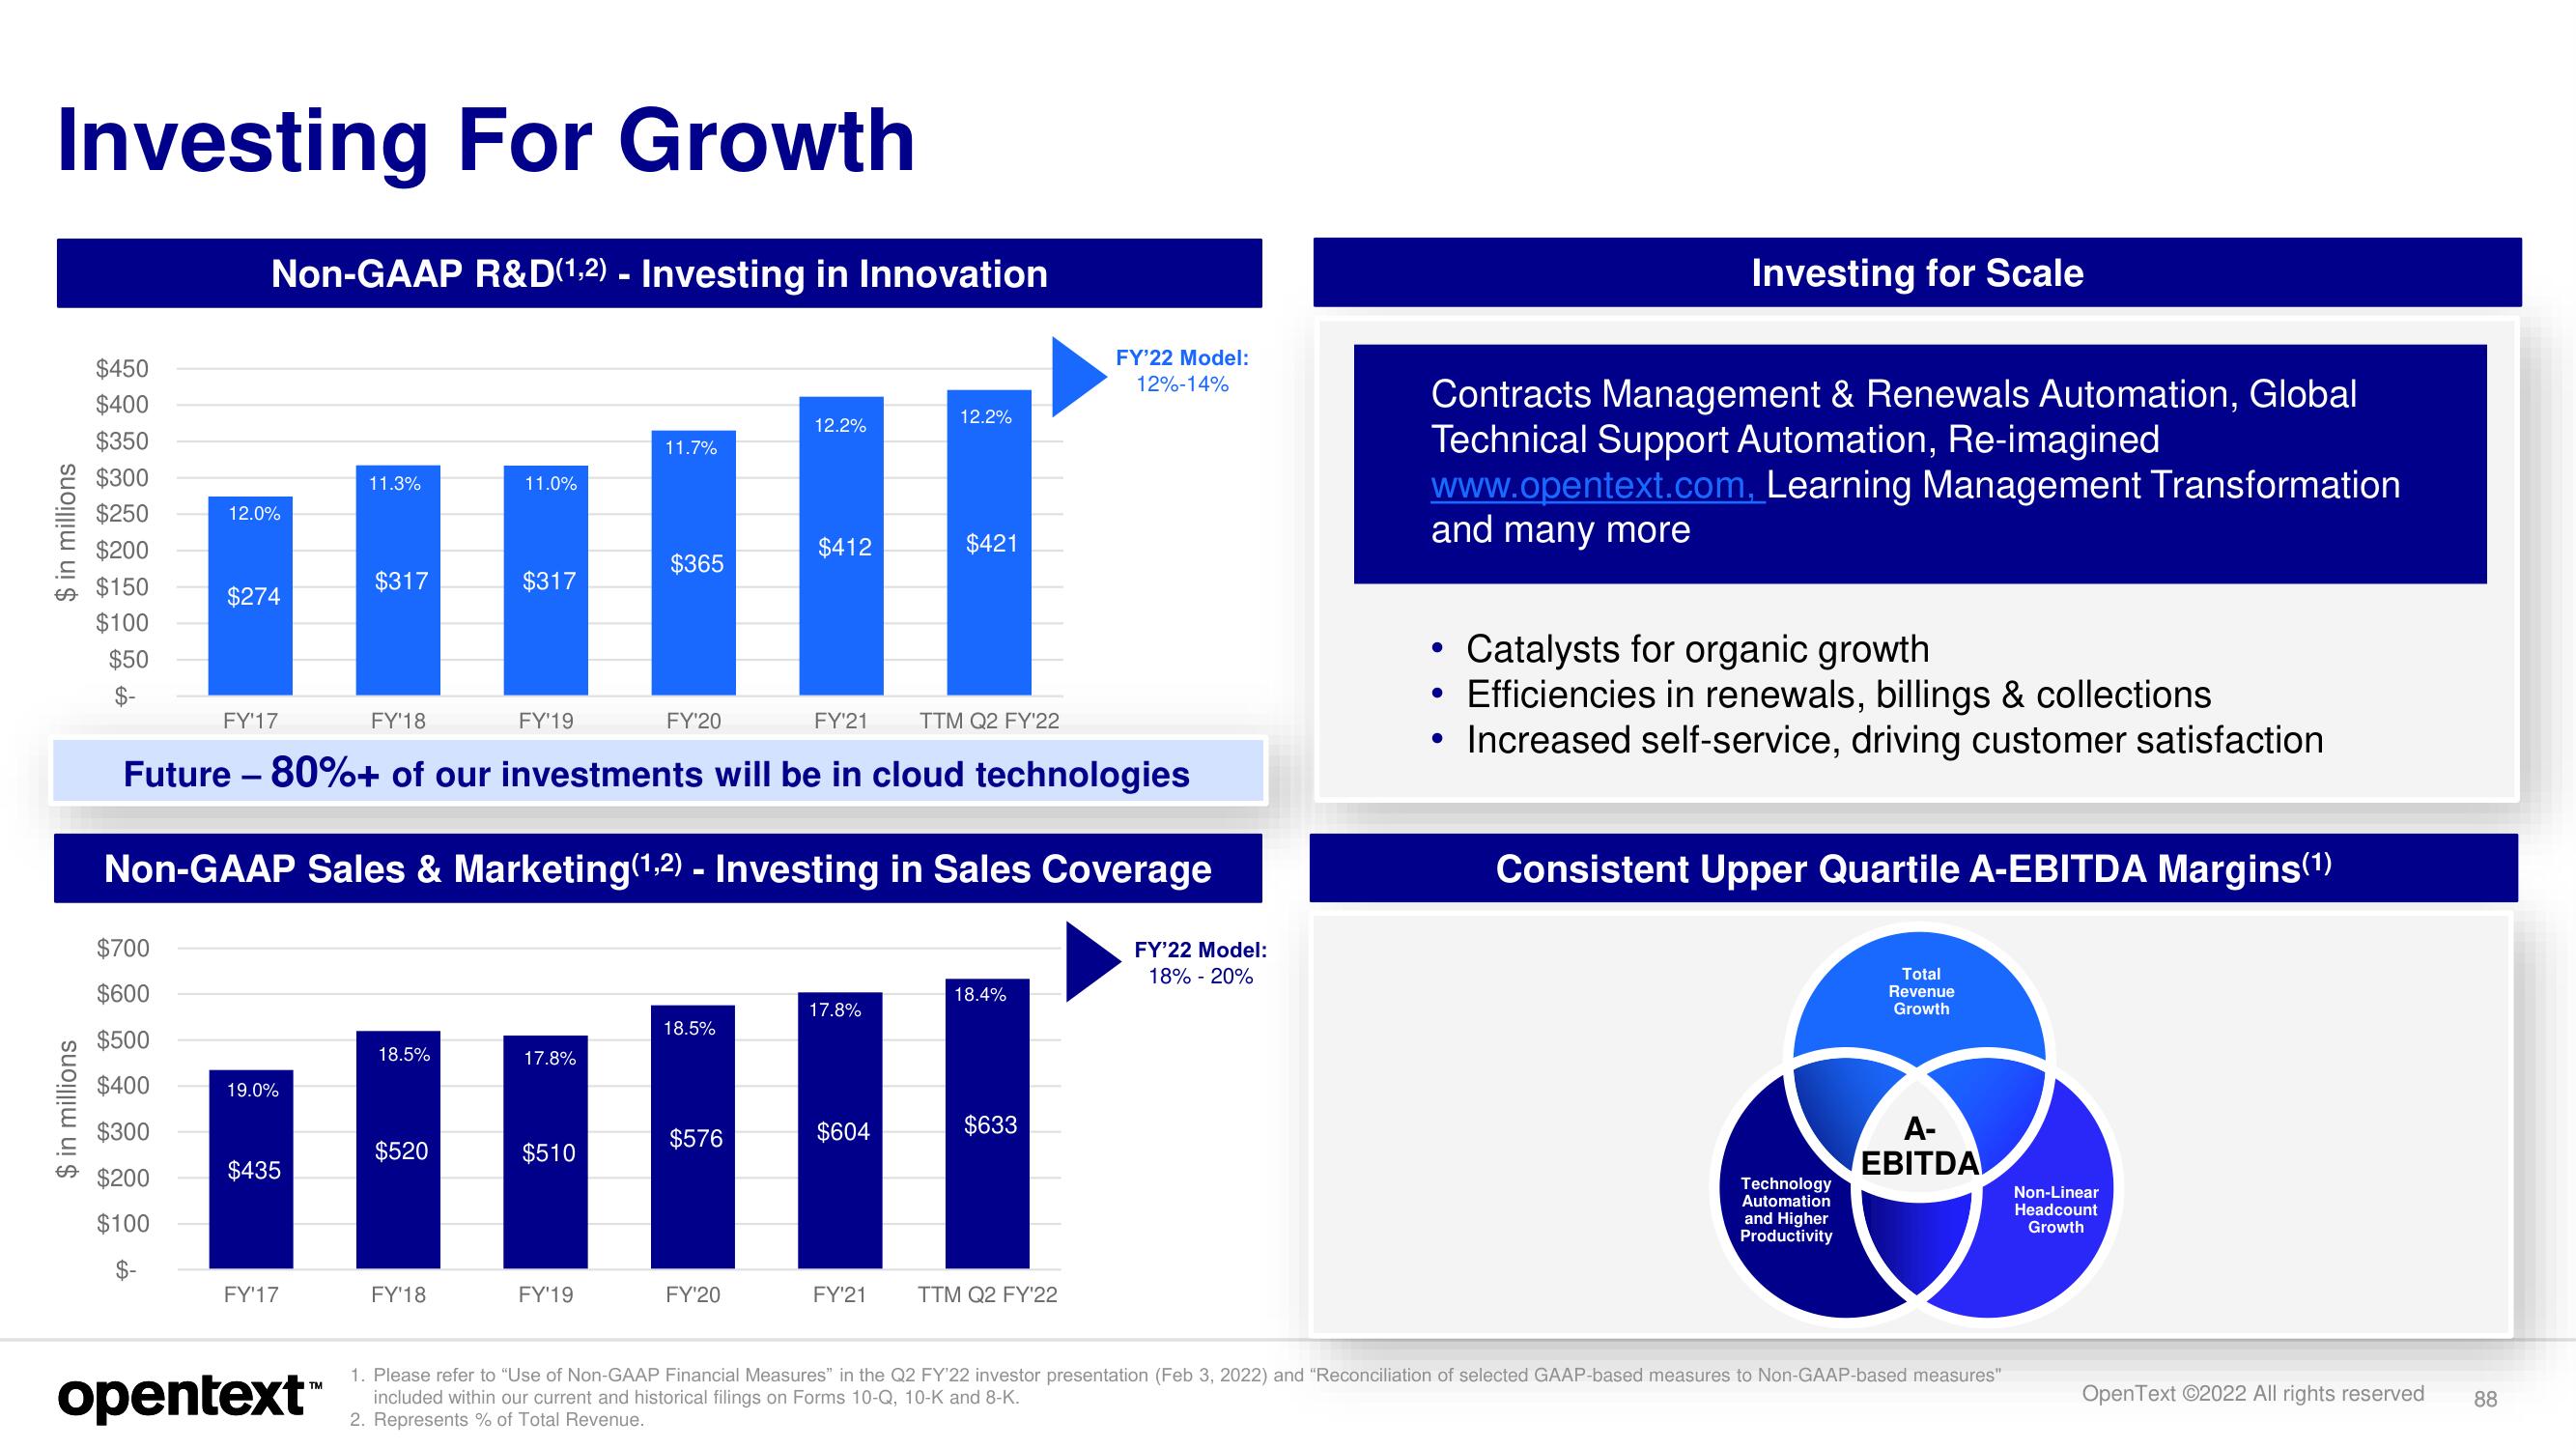
Investing For Growth
$ in millions
$ in millions
$450
$400
$350
$300
$250
$200
$150
$100
$50
$-
Non-GAAP R&D(1,2)- Investing in Innovation
$700
$600
$500
$400
$300
$200
$100
$-
12.0%
$274
19.0%
$435
FY'17
11.3%
opentext™
$317
18.5%
$520
11.0%
FY'18
$317
FY'17
FY'18
FY'21
Future - 80%+ of our investments will be in cloud technologies
Non-GAAP Sales & Marketing (1,2)- Investing in Sales Coverage
FY'19
17.8%
$510
11.7%
FY'19
$365
FY'20
18.5%
$576
12.2%
FY'20
$412
17.8%
$604
12.2%
FY'21
$421
TTM Q2 FY'22
18.4%
$633
FY'22 Model:
12%-14%
TTM Q2 FY'22
FY'22 Model:
18% - 20%
Investing for Scale
Contracts Management & Renewals Automation, Global
Technical Support Automation, Re-imagined
www.opentext.com, Learning Management Transformation
and many more
●
Catalysts for organic growth
• Efficiencies in renewals, billings & collections
• Increased self-service, driving customer satisfaction
Consistent Upper Quartile A-EBITDA Margins (1)
Technology
Automation
and Higher
Productivity
Total
Revenue
Growth
A-
EBITDA
1. Please refer to "Use of Non-GAAP Financial Measures" in the Q2 FY'22 investor presentation (Feb 3, 2022) and "Reconciliation of selected GAAP-based measures to Non-GAAP-based measures"
included within our current and historical filings on Forms 10-Q, 10-K and 8-K.
2. Represents % of Total Revenue.
Non-Linear
Headcount
Growth
OpenText ©2022 All rights reserved
88View entire presentation