T-Mobile Investor Day Presentation Deck
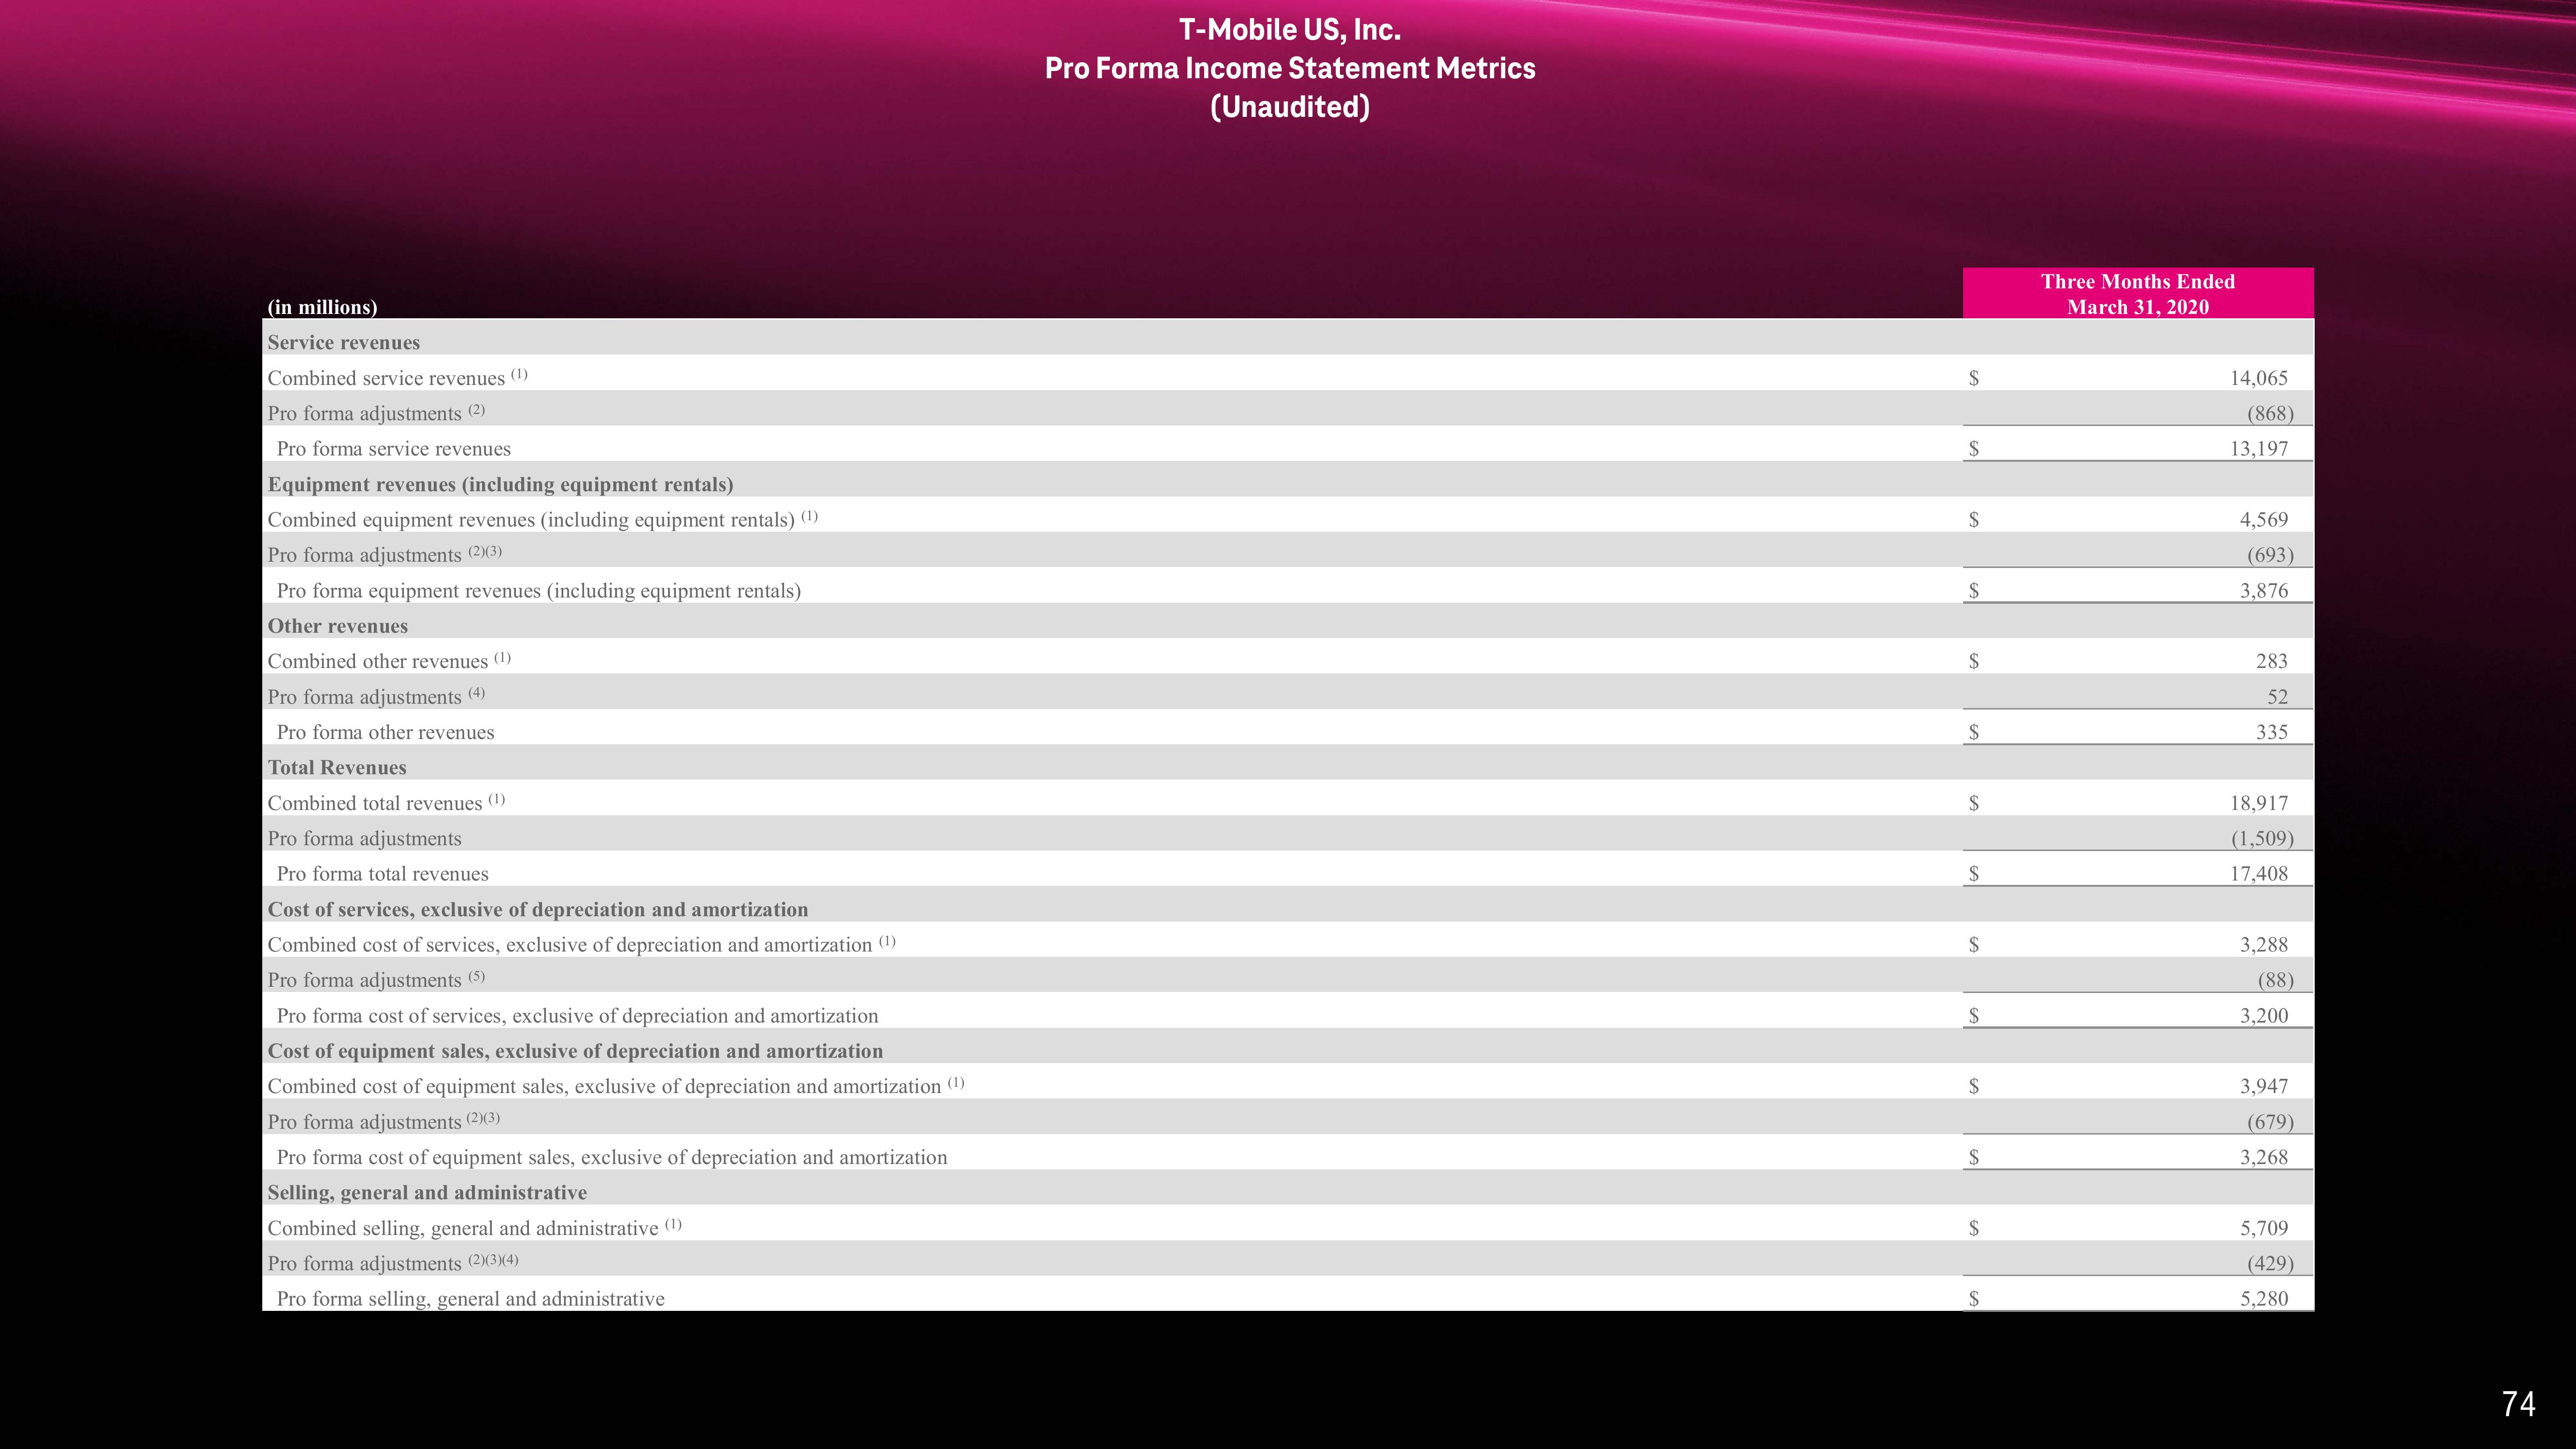
(in millions)
Service revenues
Combined service revenues (1)
Pro forma adjustments (2)
Pro forma service revenues
Equipment revenues (including equipment rentals)
Combined equipment revenues (including equipment rentals) (¹)
Pro forma adjustments (2)(3)
Pro forma equipment revenues (including equipment rentals)
Other revenues
Combined other revenues (1)
Pro forma adjustments (4)
Pro forma other revenues
Total Revenues
Combined total revenues (1)
Pro forma adjustments
Pro forma total revenues
Cost of services, exclusive of depreciation and amortization
Combined cost of services, exclusive of depreciation and amortization (¹)
Pro forma adjustments (5)
Pro forma cost of services, exclusive of depreciation and amortization
Cost of equipment sales, exclusive of depreciation and amortization
Combined cost of equipment sales, exclusive of depreciation and amortization (1)
Pro forma adjustments (2)(3)
Pro forma cost of equipment sales, exclusive of depreciation and amortization
Selling, general and administrative
Combined selling, general and administrative (1)
Pro forma adjustments (2)(3)(4)
Pro forma selling, general and administrative
T-Mobile US, Inc.
Pro Forma Income Statement Metrics
(Unaudited)
$
$
$
$
$
$
$
$
Three Months Ended
March 31, 2020
14,065
(868)
13,197
4,569
(693)
3,876
283
52
335
18,917
(1,509)
17,408
3,288
(88)
3,200
3,947
(679)
3,268
5,709
(429)
5,280
74View entire presentation