Paysafe Results Presentation Deck
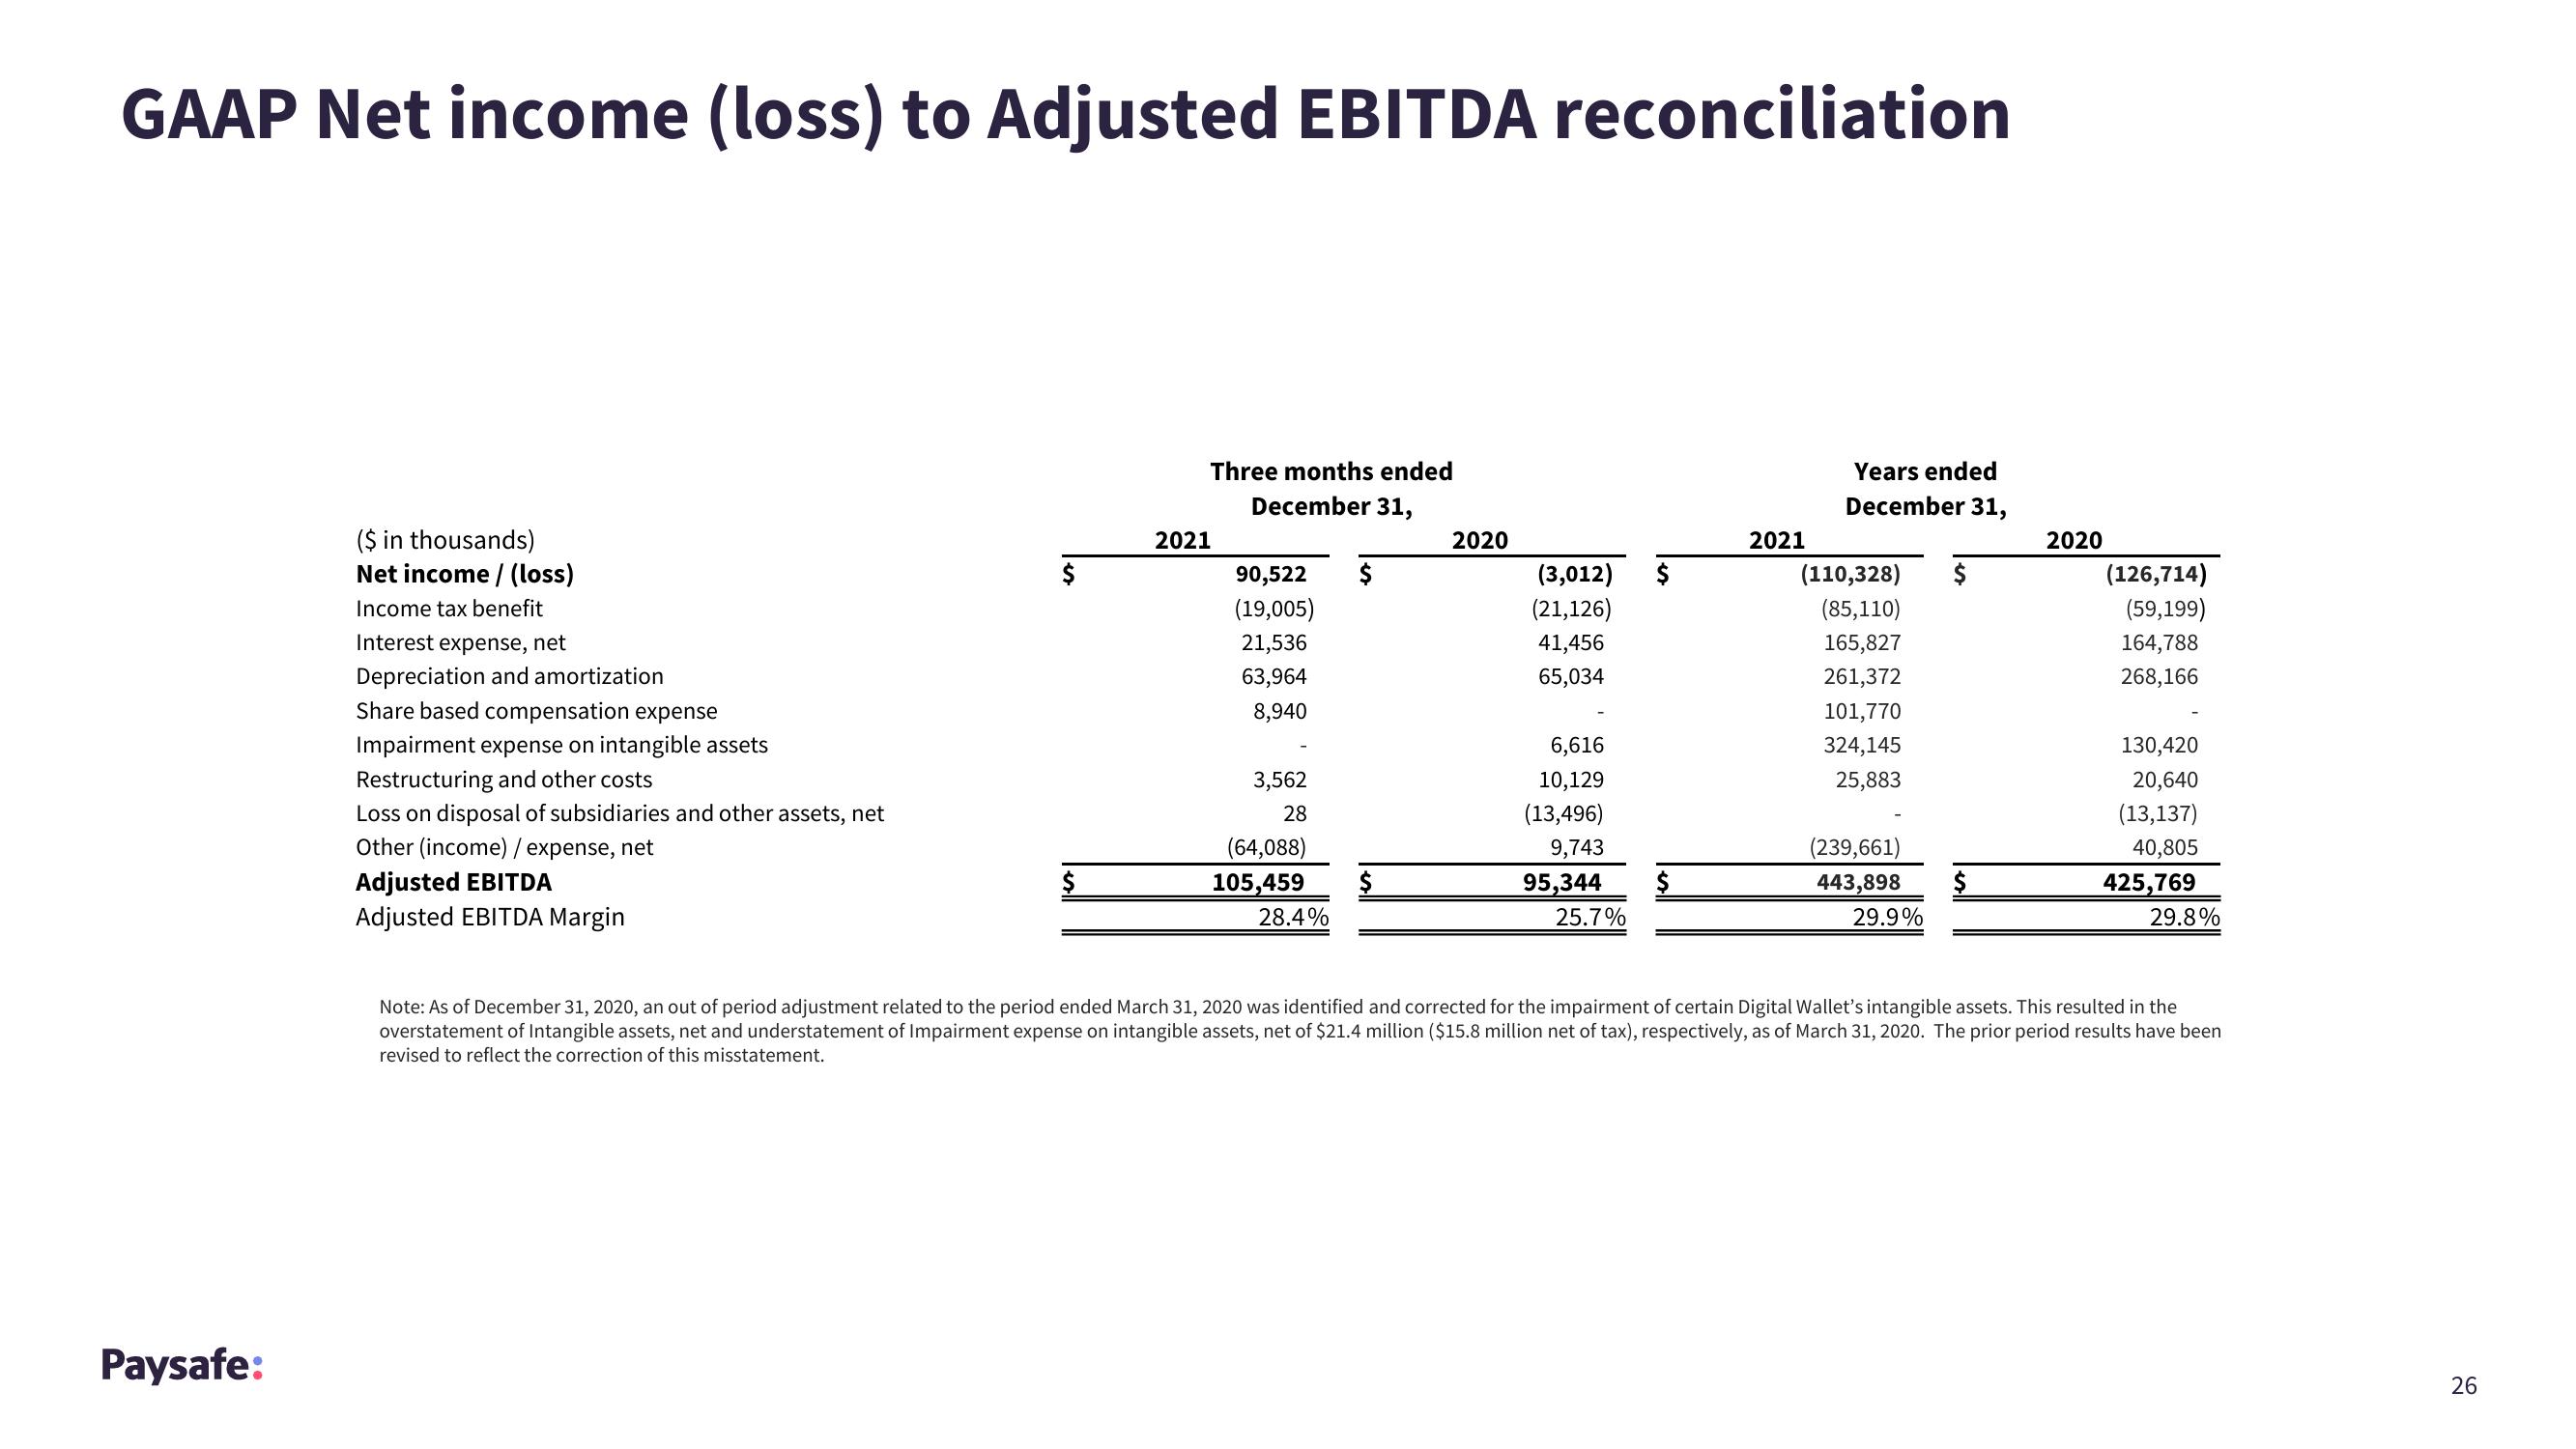
GAAP Net income (loss) to Adjusted EBITDA reconciliation
Paysafe:
($ in thousands)
Net income / (loss)
Income tax benefit
Interest expense, net
Depreciation and amortization
Share based compensation expense
Impairment expense on intangible assets
Restructuring and other costs
Loss on disposal of subsidiaries and other assets, net
Other (income) / expense, net
Adjusted EBITDA
Adjusted EBITDA Margin
$
Three months ended
December 31,
2021
90,522
(19,005)
21,536
63,964
8,940
3,562
28
(64,088)
105,459
28.4%
$
2020
(3,012) $
(21,126)
41,456
65,034
6,616
10,129
(13,496)
9,743
95,344
25.7%
$
2021
Years ended
December 31,
(110,328)
(85,110)
165,827
261,372
101,770
324,145
25,883
(239,661)
443,898
29.9%
$
$
2020
(126,714)
(59,199)
164,788
268,166
130,420
20,640
(13,137)
40,805
425,769
29.8%
Note: As of December 31, 2020, an out of period adjustment related to the period ended March 31, 2020 was identified and corrected for the impairment of certain Digital Wallet's intangible assets. This resulted in the
overstatement of Intangible assets, net and understatement of Impairment expense on intangible assets, net of $21.4 million ($15.8 million net of tax), respectively, as of March 31, 2020. The prior period results have been
revised to reflect the correction of this misstatement.
26View entire presentation