Hubspot Results Presentation Deck
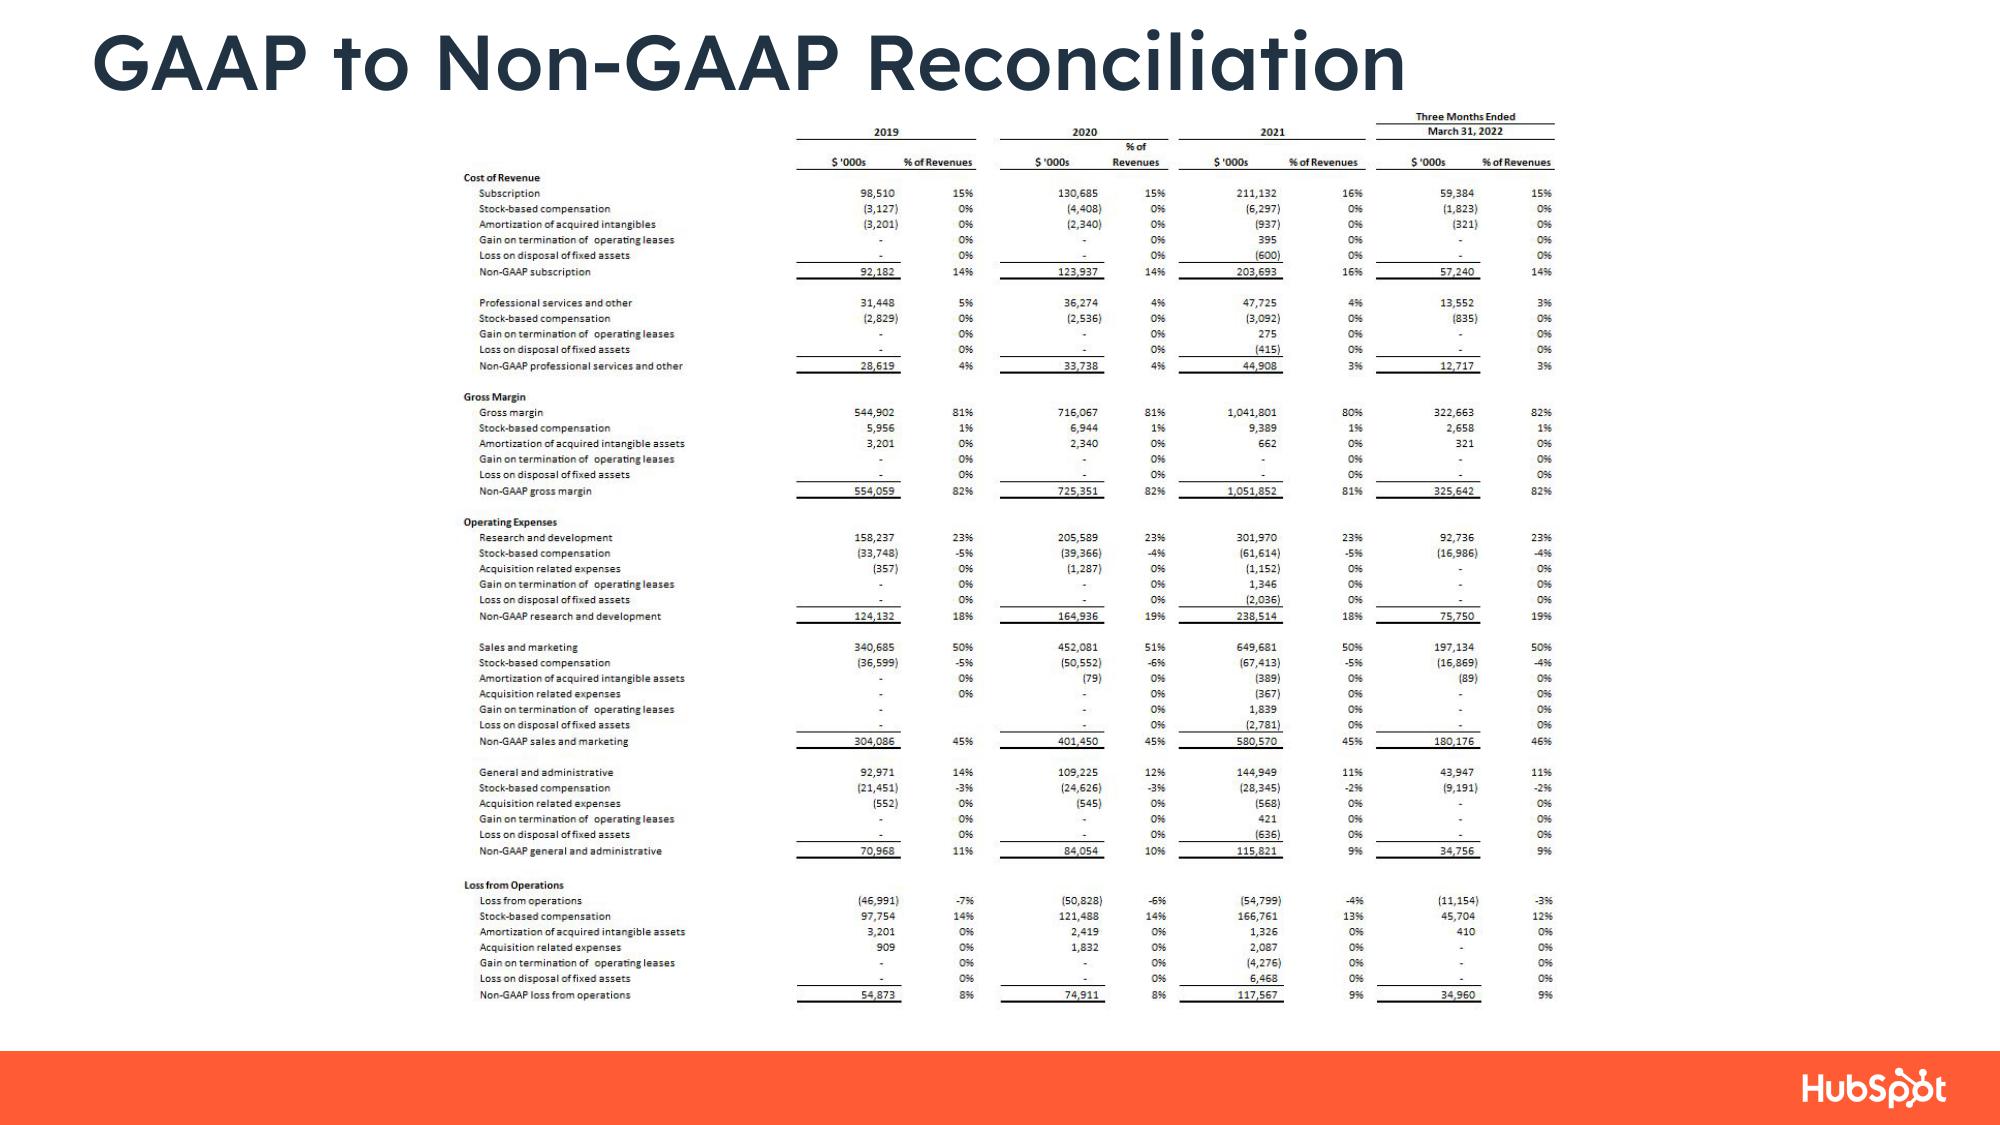
GAAP
to Non-GAAP Reconciliation
Cost of Revenue
Subscription
Stock-based compensation
Amortization of acquired intangibles
Gain on termination of operating leases
Loss on disposal of fixed assets
Non-GAAP subscription
Professional services and other
Stock-based compensation
Gain on termination of operating leases
Loss on disposal of fixed assets
Non-GAAP professional services and other
Gross Margin
Gross margin
Stock-based compensation
Amortization of acquired intangible assets
Gain on termination of operating leases
Loss on disposal of fixed assets
Non-GAAP gross margin
Operating Expenses
Research and development
Stock-based compensation
Acquisition related expenses
Gain on termination of operating leases
Loss on disposal of fixed assets
Non-GAAP research and development
Sales and marketing
Stock-based compensation
Amortization of acquired intangible assets
Acquisition related expenses
Gain on termination of operating leases
Loss on disposal of fixed assets
Non-GAAP sales and
sales and marketing
General and administrative
Stock-based compensation
Acquisition related expenses
Gain on termination of operating leases
Loss on disposal of fixed assets
Non-GAAP general and administrative
Loss from Operations
Loss from operations
Stock-based compensation
Amortization of acquired intangible assets
Acquisition related expenses
Gain on termination of operating leases
Loss on disposal of fixed assets
Non-GAAP loss from operations
$'000s
2019
98,510
(3,127)
(3,201)
92,182
31,448
(2,829)
28,619
544,902
5,956
3,201
554,059
158,237
(33,748)
(357)
124,132
340,685
(36,599)
***1
304,086
92,971
(21,451)
(552)
70,968
(46,991)
97,754
3,201
909
54,873
% of Revenues
15%
0%
0%
0%
096
14%
5%
096
0%
0%
4%
81%
196
0%
0%
0%
82%
23%
-5%
096
096
0%
18%
50%
-5%
096
0%
45%
14%
-3%
0%
0%
0%
11%
-7%
14%
096
0%
0%
0%
8%
$'000s
2020
130,685
(4,408)
(2,340)
123,937
36,274
(2,536)
33,738
716,067
6,944
2,340
725,351
205,589
(39,366)
(1,287)
164,936
452,081
(50,552)
(79)
401,450
109,225
(24,626)
(545)
84,054
(50,828)
121,488
2,419
1,832
74,911
% of
Revenues
15%
096
0%
0%
096
14%
4%
0%
0%
0%
4%
81%
1%
0%
09
096
82%
23%
-4%
096
0%
0%
19%
51%
-6%
0%
0%
096
0%
45%
12%
-3%
0%
0%
096
10%
-6%
1496
0%
0%
0%
0%
8%
$'000s
2021
211,132
(6,297)
(937)
395
(600)
203,693
47,725
(3,092)
275
(415)
44,908
1,041,801
9,389
662
1,051,852
301,970
(61,614)
(1,152)
1,346
(2,036)
238,514
649,681
(67,413)
(389)
(367)
1,839
(2,781)
580,570
144,949
(28,345)
(568)
421
(636)
115,821
(54,799)
166,761
1,326
2,087
(4,276)
6,468
117,567
% of Revenues
16%
096
096
0%
0%
16%
4%
0%
0%
096
39
80%
196
096
0%
096
81%
*48884 $48888* *888*
-496
13%
096
0%
096
0%
996
Three Months Ended
March 31, 2022
$'000s
59,384
(1,823)
(321)
57,240
13,552
(835)
12,717
322,663
2,658
321
325,642
92,736
(16,986)
75,750
197,134
(16,869)
(89)
180,176
43,947
(9,191)
34,756
(11,154)
45,704
410
34,960
% of Revenues
15%
096
0%
0%
0%
14%
3%
096
096
0%
3%
82%
19
096
0%
096
82%
* *888* 8*888** ******
-3%
12%
096
0%
0%
096
9%
HubSpotView entire presentation