GlobalFoundries Investor Day Presentation Deck
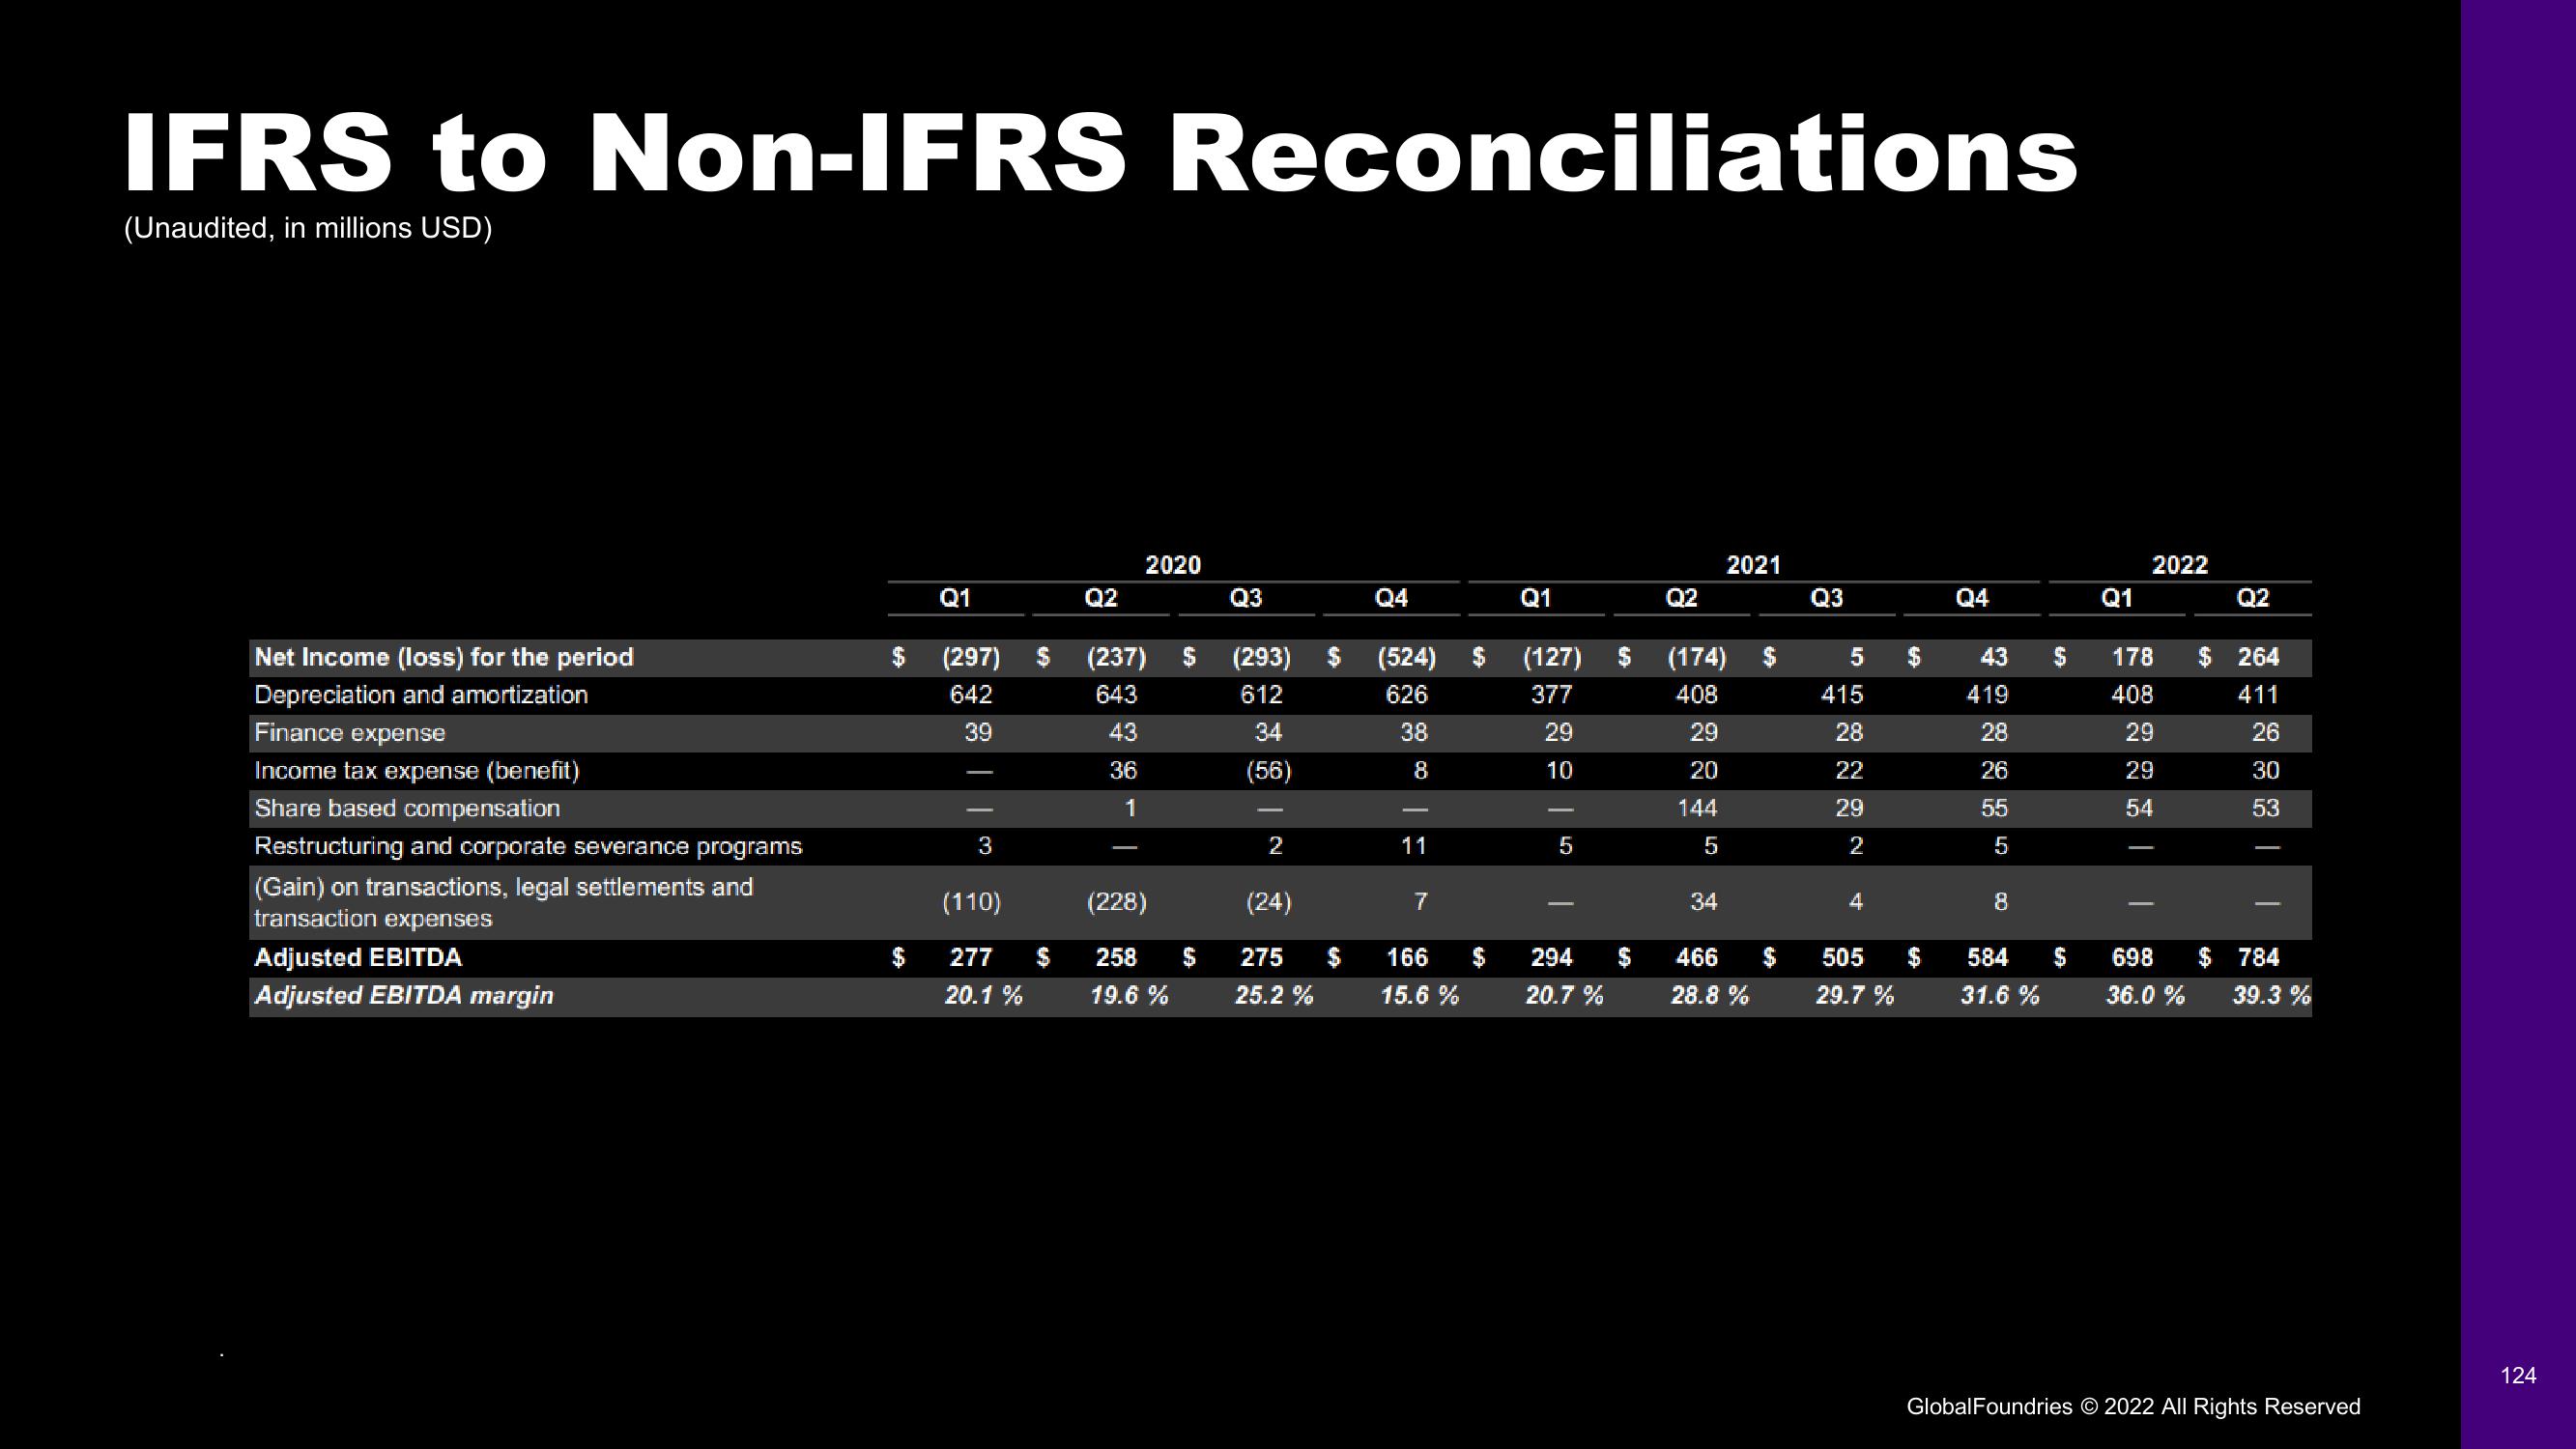
IFRS to Non-IFRS Reconciliations
(Unaudited, in millions USD)
Net Income (loss) for the period
Depreciation and amortization
Finance expense
Income tax expense (benefit)
Share based compensation
Restructuring and corporate severance programs
(Gain) on transactions, legal settlements and
transaction expenses
Adjusted EBITDA
Adjusted EBITDA margin
$
Q1
(297)
642
39
$
(110)
277 $
20.1%
Q2
2020
(237) $
643
43
36
1
(228)
258 $
19.6 %
Q3
(293)
612
34
(56)
2
(24)
275
$
25.2 %
Q4
(524)
626
38
8
11
7
166
15.6 %
Q1
(127) $ (174)
377
408
29
29
10
20
144
5
5
294
20.7%
Q2
$
34
2021
466
28.8 %
Q3
5
415
28
22
29
2
4
$
505 $
29.7 %
Q4
43
419
28
26
55
5
8
584
31.6%
6.0
$
Q1
2022
178 $ 264
408
411
29
26
29
30
54
53
I
Q2
698
36.0 %
$ 784
39.3%
GlobalFoundries © 2022 All Rights Reserved
124View entire presentation