Credit Suisse Investment Banking Pitch Book
CONFIDENTIAL
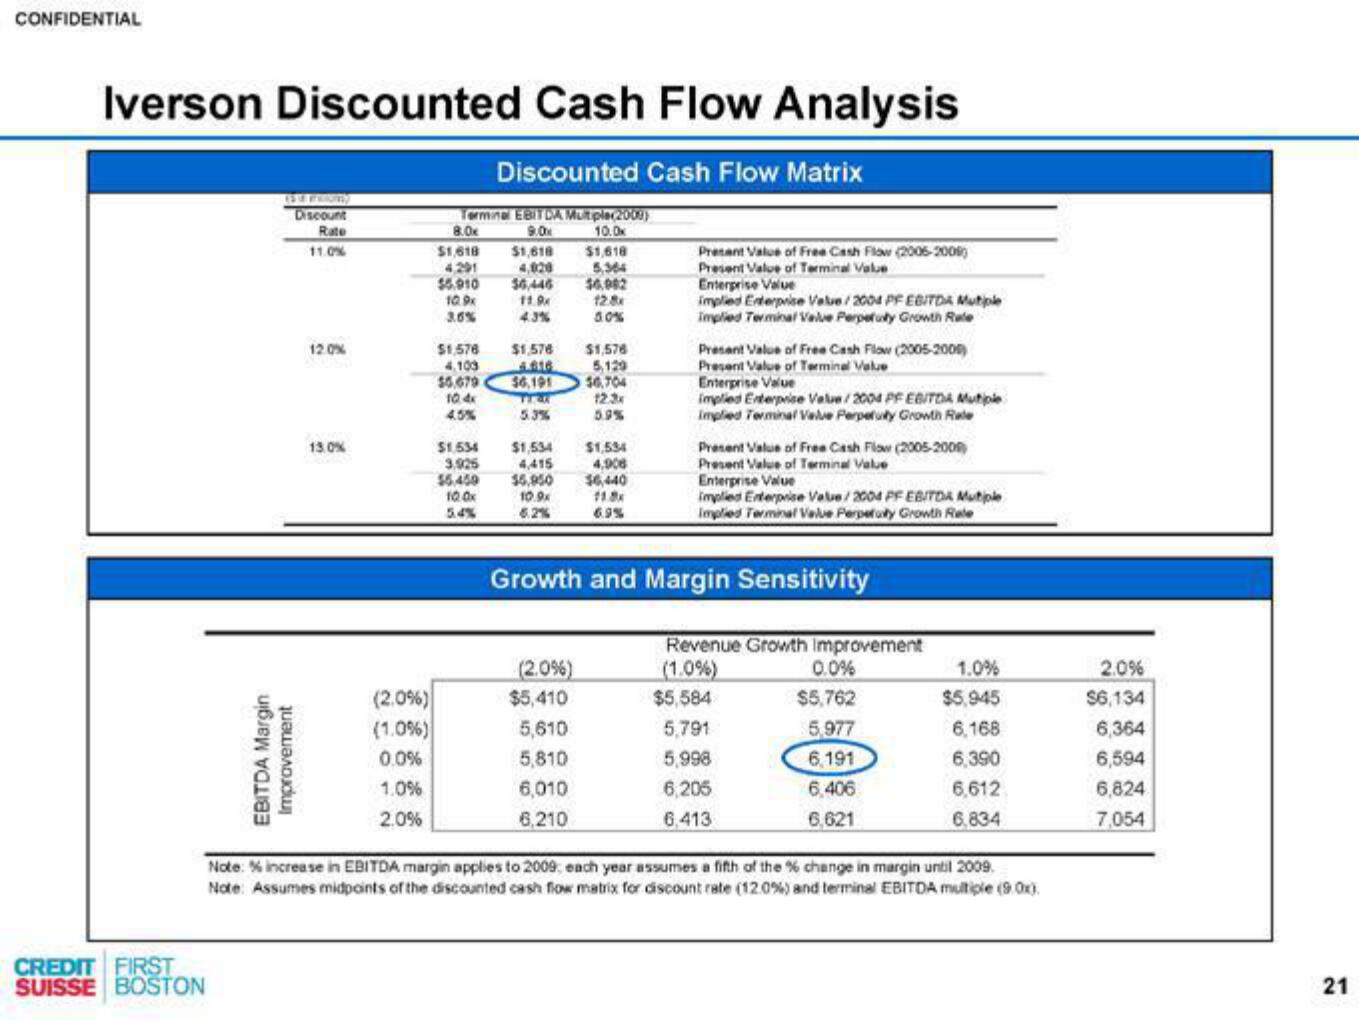
Iverson Discounted Cash Flow Analysis
Discounted Cash Flow Matrix
CREDIT FIRST
SUISSE BOSTON
Discount
Rate
11.0%
12.0%
13.0%
(2.0%)
(1.0%)
0.0%
1.0%
2.0%
Terminal EBITDA Multiple(2009)
8.0x
10.0
9.0x
$1,618 $1,618 $1,618
4,291 4,020
5,364
$5.910 $6,446 $6,902
10.9x 11.9x
3.6%
50%
$1,576
$0,704
12.3x
5.9%
$1,576
4,109
$5,679
10.4x
4.5%
$1,576
4.816
$6,191
TEAK
5.3%
$1.534
$1,534
$1,534
3.925 4,415 4,908
$5,459 $5,950 $6,440
100x 10.9
11.8x
6.2%
6.9%
(2.0%)
$5,410
Present Value of Free Cash Flow (2005-2006)
Present Value of Terminal Value
5,610
5,810
6,010
6,210
Enterprise Value
implied Enterprise Value/2004 PF EBITDA Mutiple
Implied Terminal Valve Perpetuly Growth Rute
Present Value of Free Cash Flow (2005-2009)
Present Value of Terminal Value
Enterprise Value
implied Enterprise Value/2004 PF EBITDA Mutiple
Implied Terminal Valve Perpetuly Growth Rale
Growth and Margin Sensitivity
Present Value of Free Cash Flow (2005-2009)
Present Value of Terminal Value
Enterprise Value
implied Enterprise Value/2004 PF EBITDA Mutiple
Implied Terminal Valve Perpetuty Growth Rate
Revenue Growth Improvement
(1.0%)
$5,584
5,791
5,998
6,205
6.413
0.0%
$5,762
5,977
6,191
6,406
6,621
1.0%
$5,945
6,168
6,390
6,612
6,834
Note: % increase in EBITDA margin applies to 2009: each year assumes a fifth of the % change in margin until 2009.
Note: Assumes midpoints of the discounted cash flow matrix for discount rate ( 12.0%) and terminal EBITDA multiple (90x)
2.0%
$6,134
6,364
6,594
6,824
7,054
21View entire presentation