Avantor Results Presentation Deck
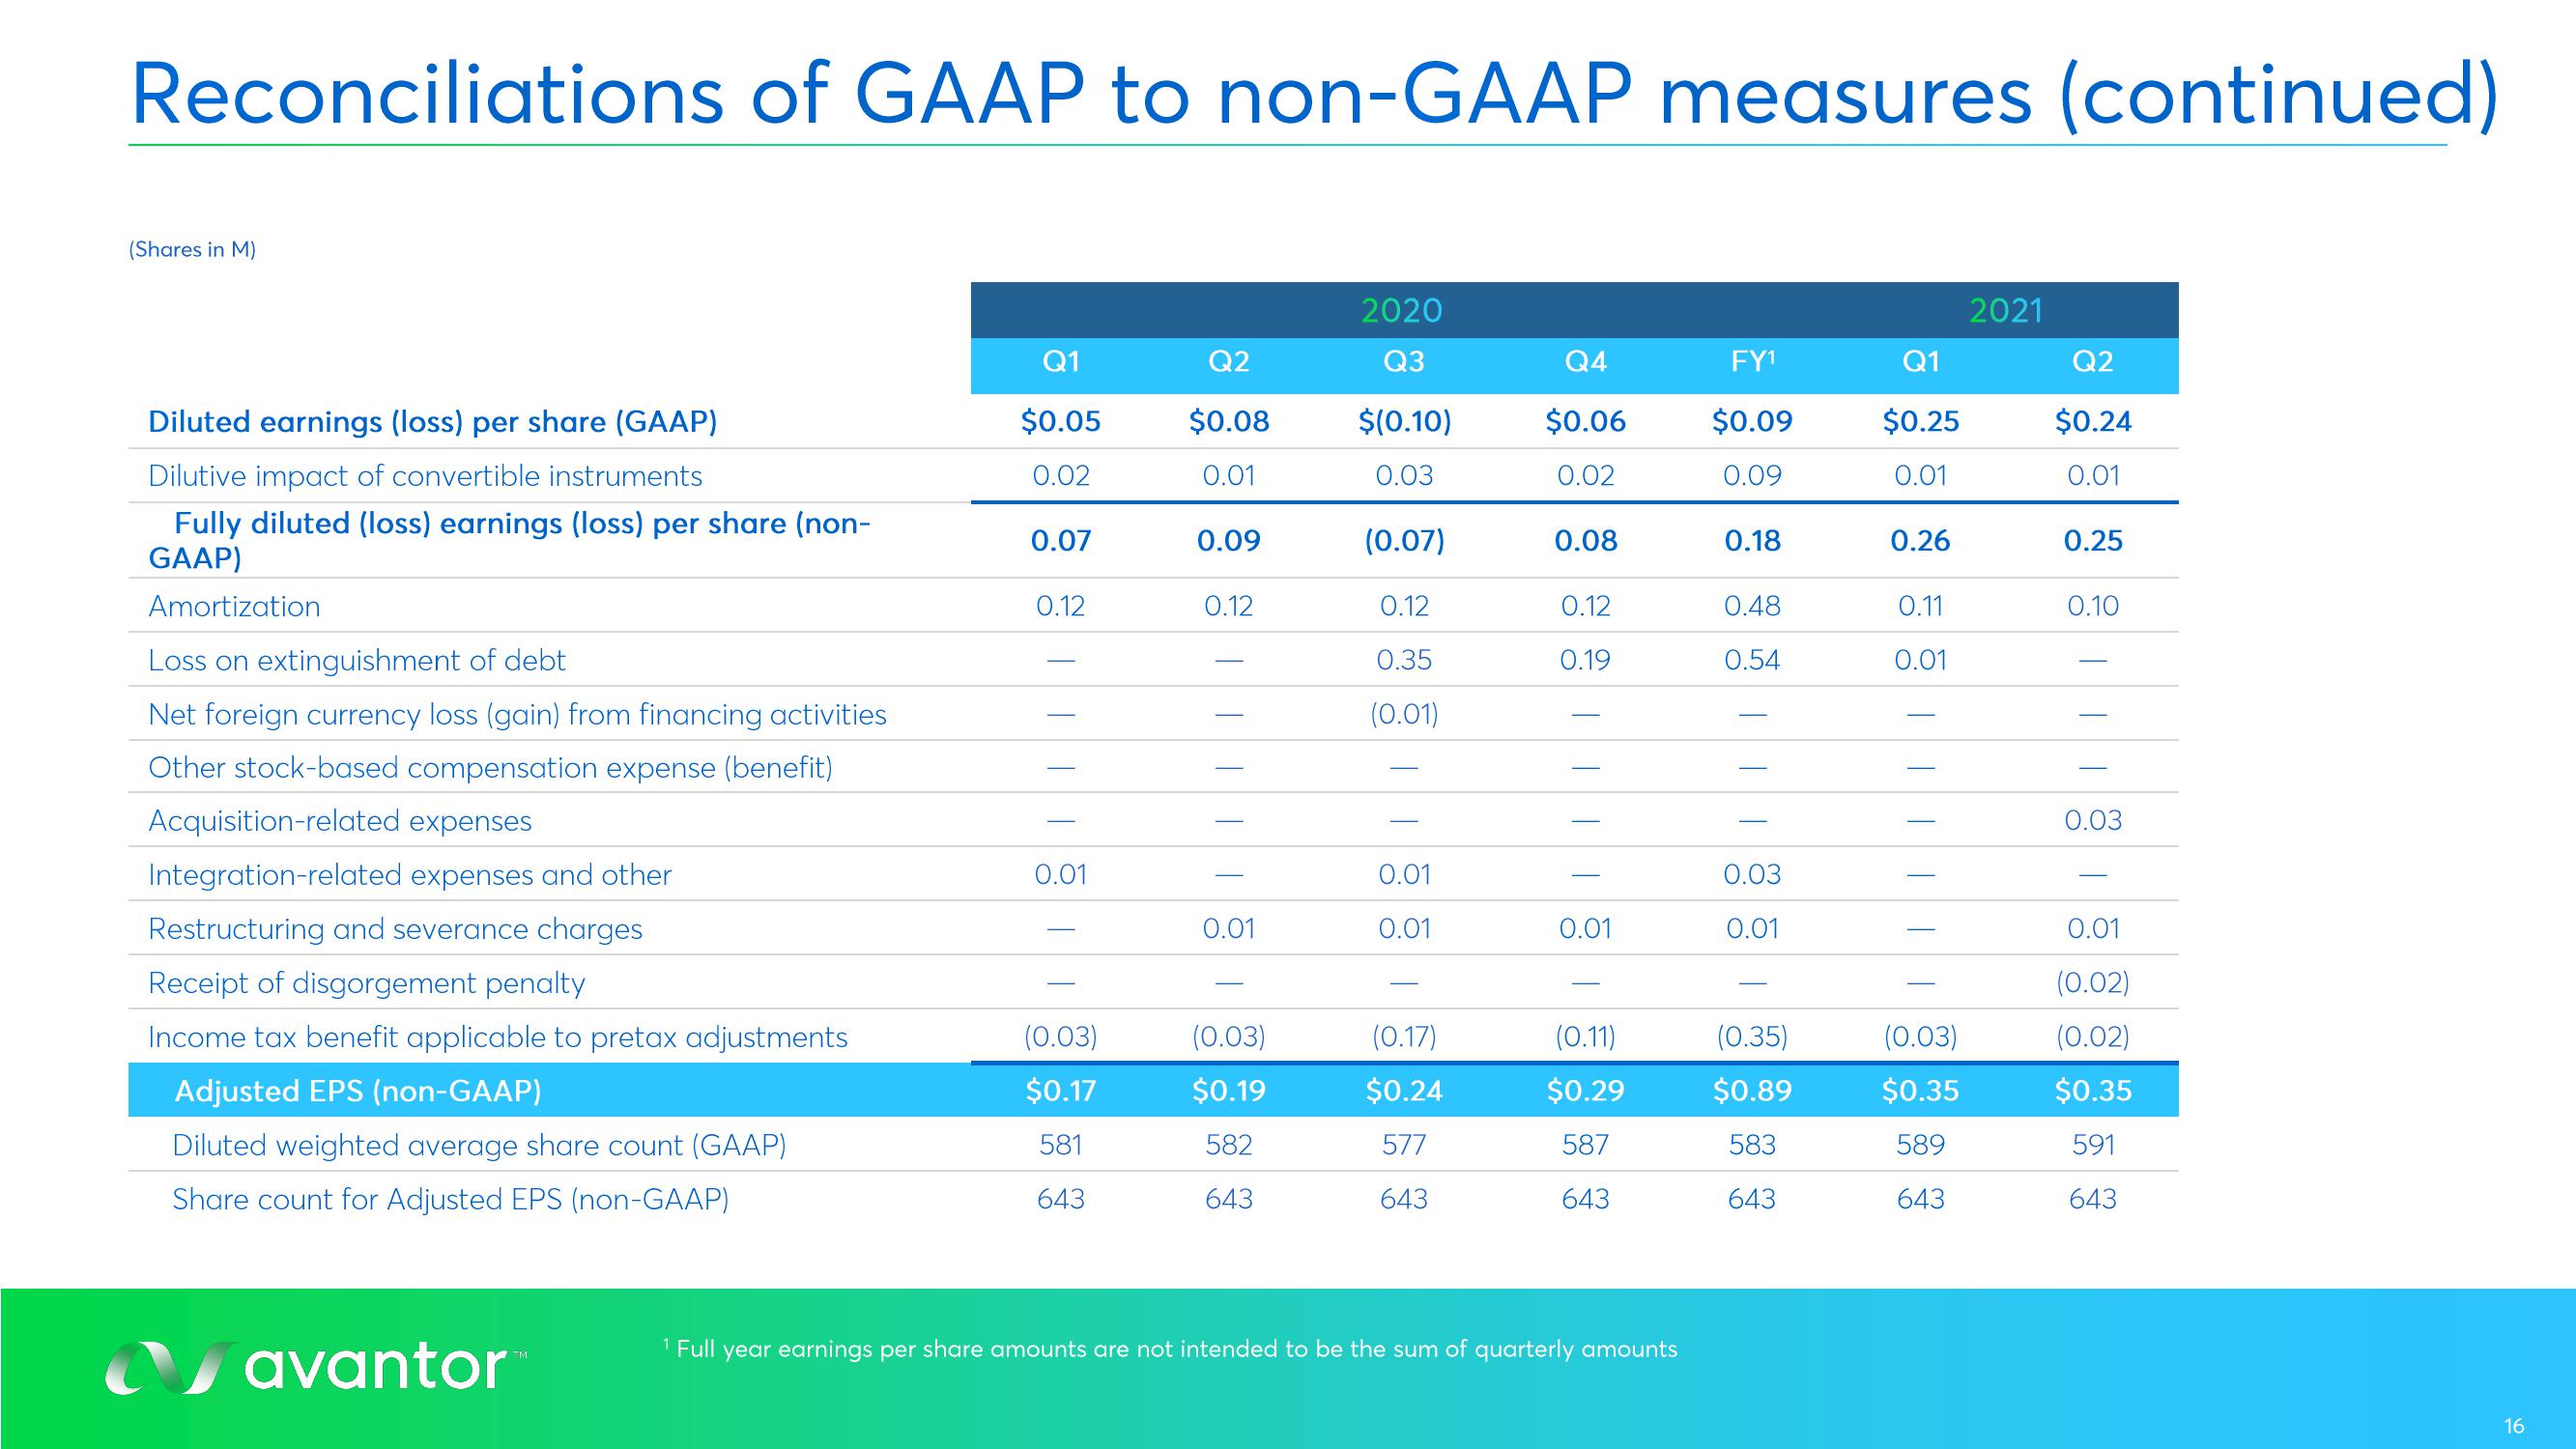
Reconciliations of GAAP to non-GAAP measures (continued)
(Shares in M)
Diluted earnings (loss) per share (GAAP)
Dilutive impact of convertible instruments
Fully diluted (loss) earnings (loss) per share (non-
GAAP)
Amortization
Loss on extinguishment of debt
Net foreign currency loss (gain) from financing activities
Other stock-based compensation expense (benefit)
Acquisition-related expenses
Integration-related expenses and other
Restructuring and severance charges
Receipt of disgorgement penalty
Income tax benefit applicable to pretax adjustments
Adjusted EPS (non-GAAP)
Diluted weighted average share count (GAAP)
Share count for Adjusted EPS (non-GAAP)
avantor™
Q1
$0.05
0.02
0.07
0.12
||||
0.01
(0.03)
$0.17
581
643
Q2
$0.08
0.01
0.09
0.12
0.01
(0.03)
$0.19
582
643
2020
Q3
$(0.10)
0.03
(0.07)
0.12
0.35
(0.01)
0.01
0.01
(0.17)
$0.24
577
643
Q4
$0.06
0.02
0.08
0.12
0.19
|||||||
0.01
(0.11)
$0.29
587
643
¹ Full year earnings per share amounts are not intended to be the sum of quarterly amounts
FY¹
$0.09
0.09
0.18
0.48
0.54
0.03
0.01
(0.35)
$0.89
583
643
Q1
$0.25
0.01
0.26
0.11
0.01
(0.03)
$0.35
589
643
2021
Q2
$0.24
0.01
0.25
0.10
0.03
0.01
(0.02)
(0.02)
$0.35
591
643
16View entire presentation