J.P.Morgan Results Presentation Deck
Corporate & Investment Bank1
SELECTED INCOME STATEMENT DATA ($MM)
Revenue
Investment Banking revenue
Payments²
Lending
Total Banking
Fixed Income Markets
Equity Markets
Securities Services.
Credit Adjustments & Other
Total Markets & Securities Services
Expense²
Credit costs
Net income
KEY DRIVERS / STATISTICS ($B)³
Equity
ROE
Overhead ratio²
Comp/revenue
IB fees ($mm)
Average loans
Average client deposits
Merchant processing volume
Assets under custody ($T)
ALL/EOP loans ex-conduits and trade
Net charge-off/(recovery) rate
Average VaR ($mm)
1 See note 1 on slide 11
2 See note 3 on slide 12
For additional footnotes see slide 13.
5
6
JPMORGAN CHASE & CO.
2Q23
$12,519
1,494
2,451
299
4,244
4,567
2,451
1,221
36
8,275
6,894
38
$4,092
2Q23
$108.0
15%
55
28
$1,557
227.3
647.5
600.1
30.4
1.86%
0.12
$44
$ 0/(U)
1Q23
($1,081)
(66)
55
32
21
(1,132)
(232)
73
189
(1,102)
(589)
(20)
($329)
1Q23
$108.0
16%
55
30
$1,654
228.1
633.7
558.8
29.7
1.81%
0.11
$45
2Q22
$516
143
932
(111)
964
(144)
(628)
70
254
(448)
84
(21)
$375
2Q22
$103.0
14%
57
29
$1,650
218.0
722.4
539.6
28.6
1.38%
0.09
$52
CCB
CIB
CB
AWM Corp.
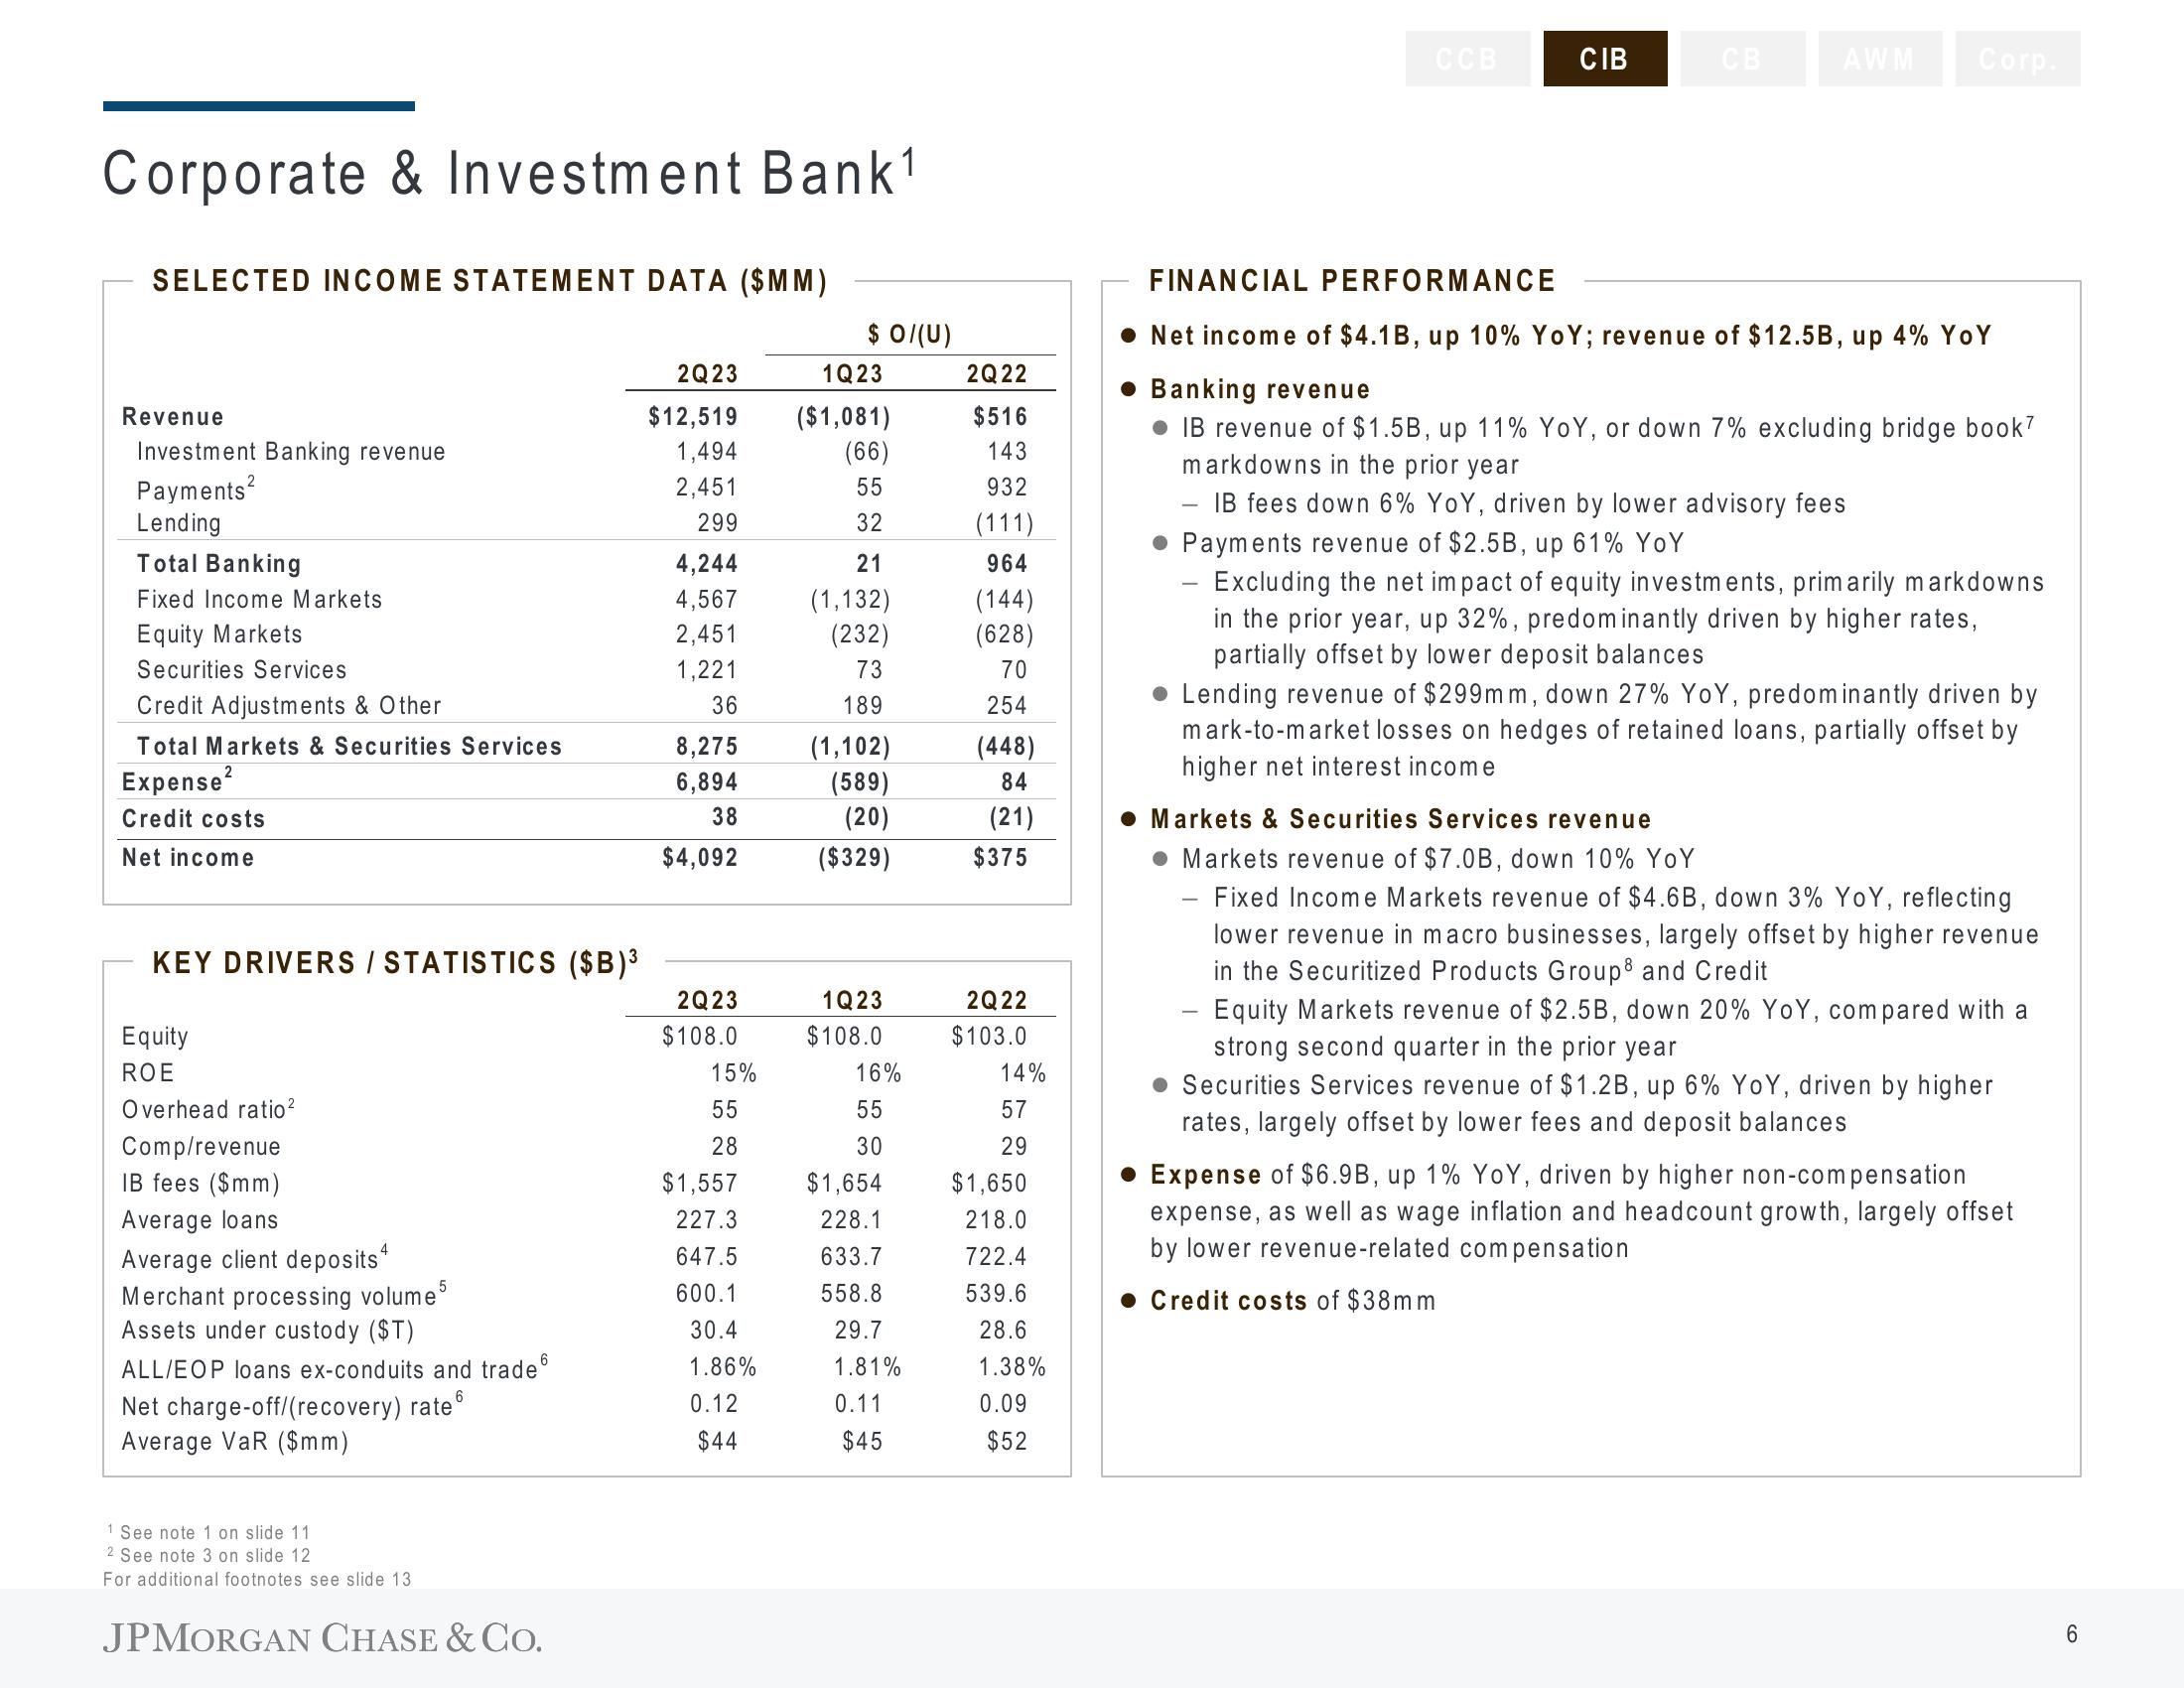
FINANCIAL PERFORMANCE
Net income of $4.1B, up 10% YoY; revenue of $12.5B, up 4% YoY
Banking revenue
• IB revenue of $1.5B, up 11% YoY, or down 7% excluding bridge book?
markdowns in the prior year
IB fees down 6% YoY, driven by lower advisory fees
Payments revenue of $2.5B, up 61% YoY
Excluding the net impact of equity investments, primarily markdowns
in the prior year, up 32%, predominantly driven by higher rates,
partially offset by lower deposit balances
Lending revenue of $299mm, down 27% YoY, predominantly driven by
mark-to-market losses on hedges of retained loans, partially offset by
higher net interest income
Markets & Securities Services revenue
• Markets revenue of $7.0B, down 10% YoY
Fixed Income Markets revenue of $4.6B, down 3% YoY, reflecting
lower revenue in macro businesses, largely offset by higher revenue
in the Securitized Products Group and Credit
- Equity Markets revenue of $2.5B, down 20% YoY, compared with a
strong second quarter in the prior year
Securities Services revenue of $1.2B, up 6% YoY, driven by higher
rates, largely offset by lower fees and deposit balances
Expense of $6.9B, up 1% YoY, driven by higher non-compensation
expense, as well as wage inflation and headcount growth, largely offset
by lower revenue-related compensation
Credit costs of $38mm
6View entire presentation