Corecentric Investor Presentation Deck slide image

Corecentric Investor Presentation Deck

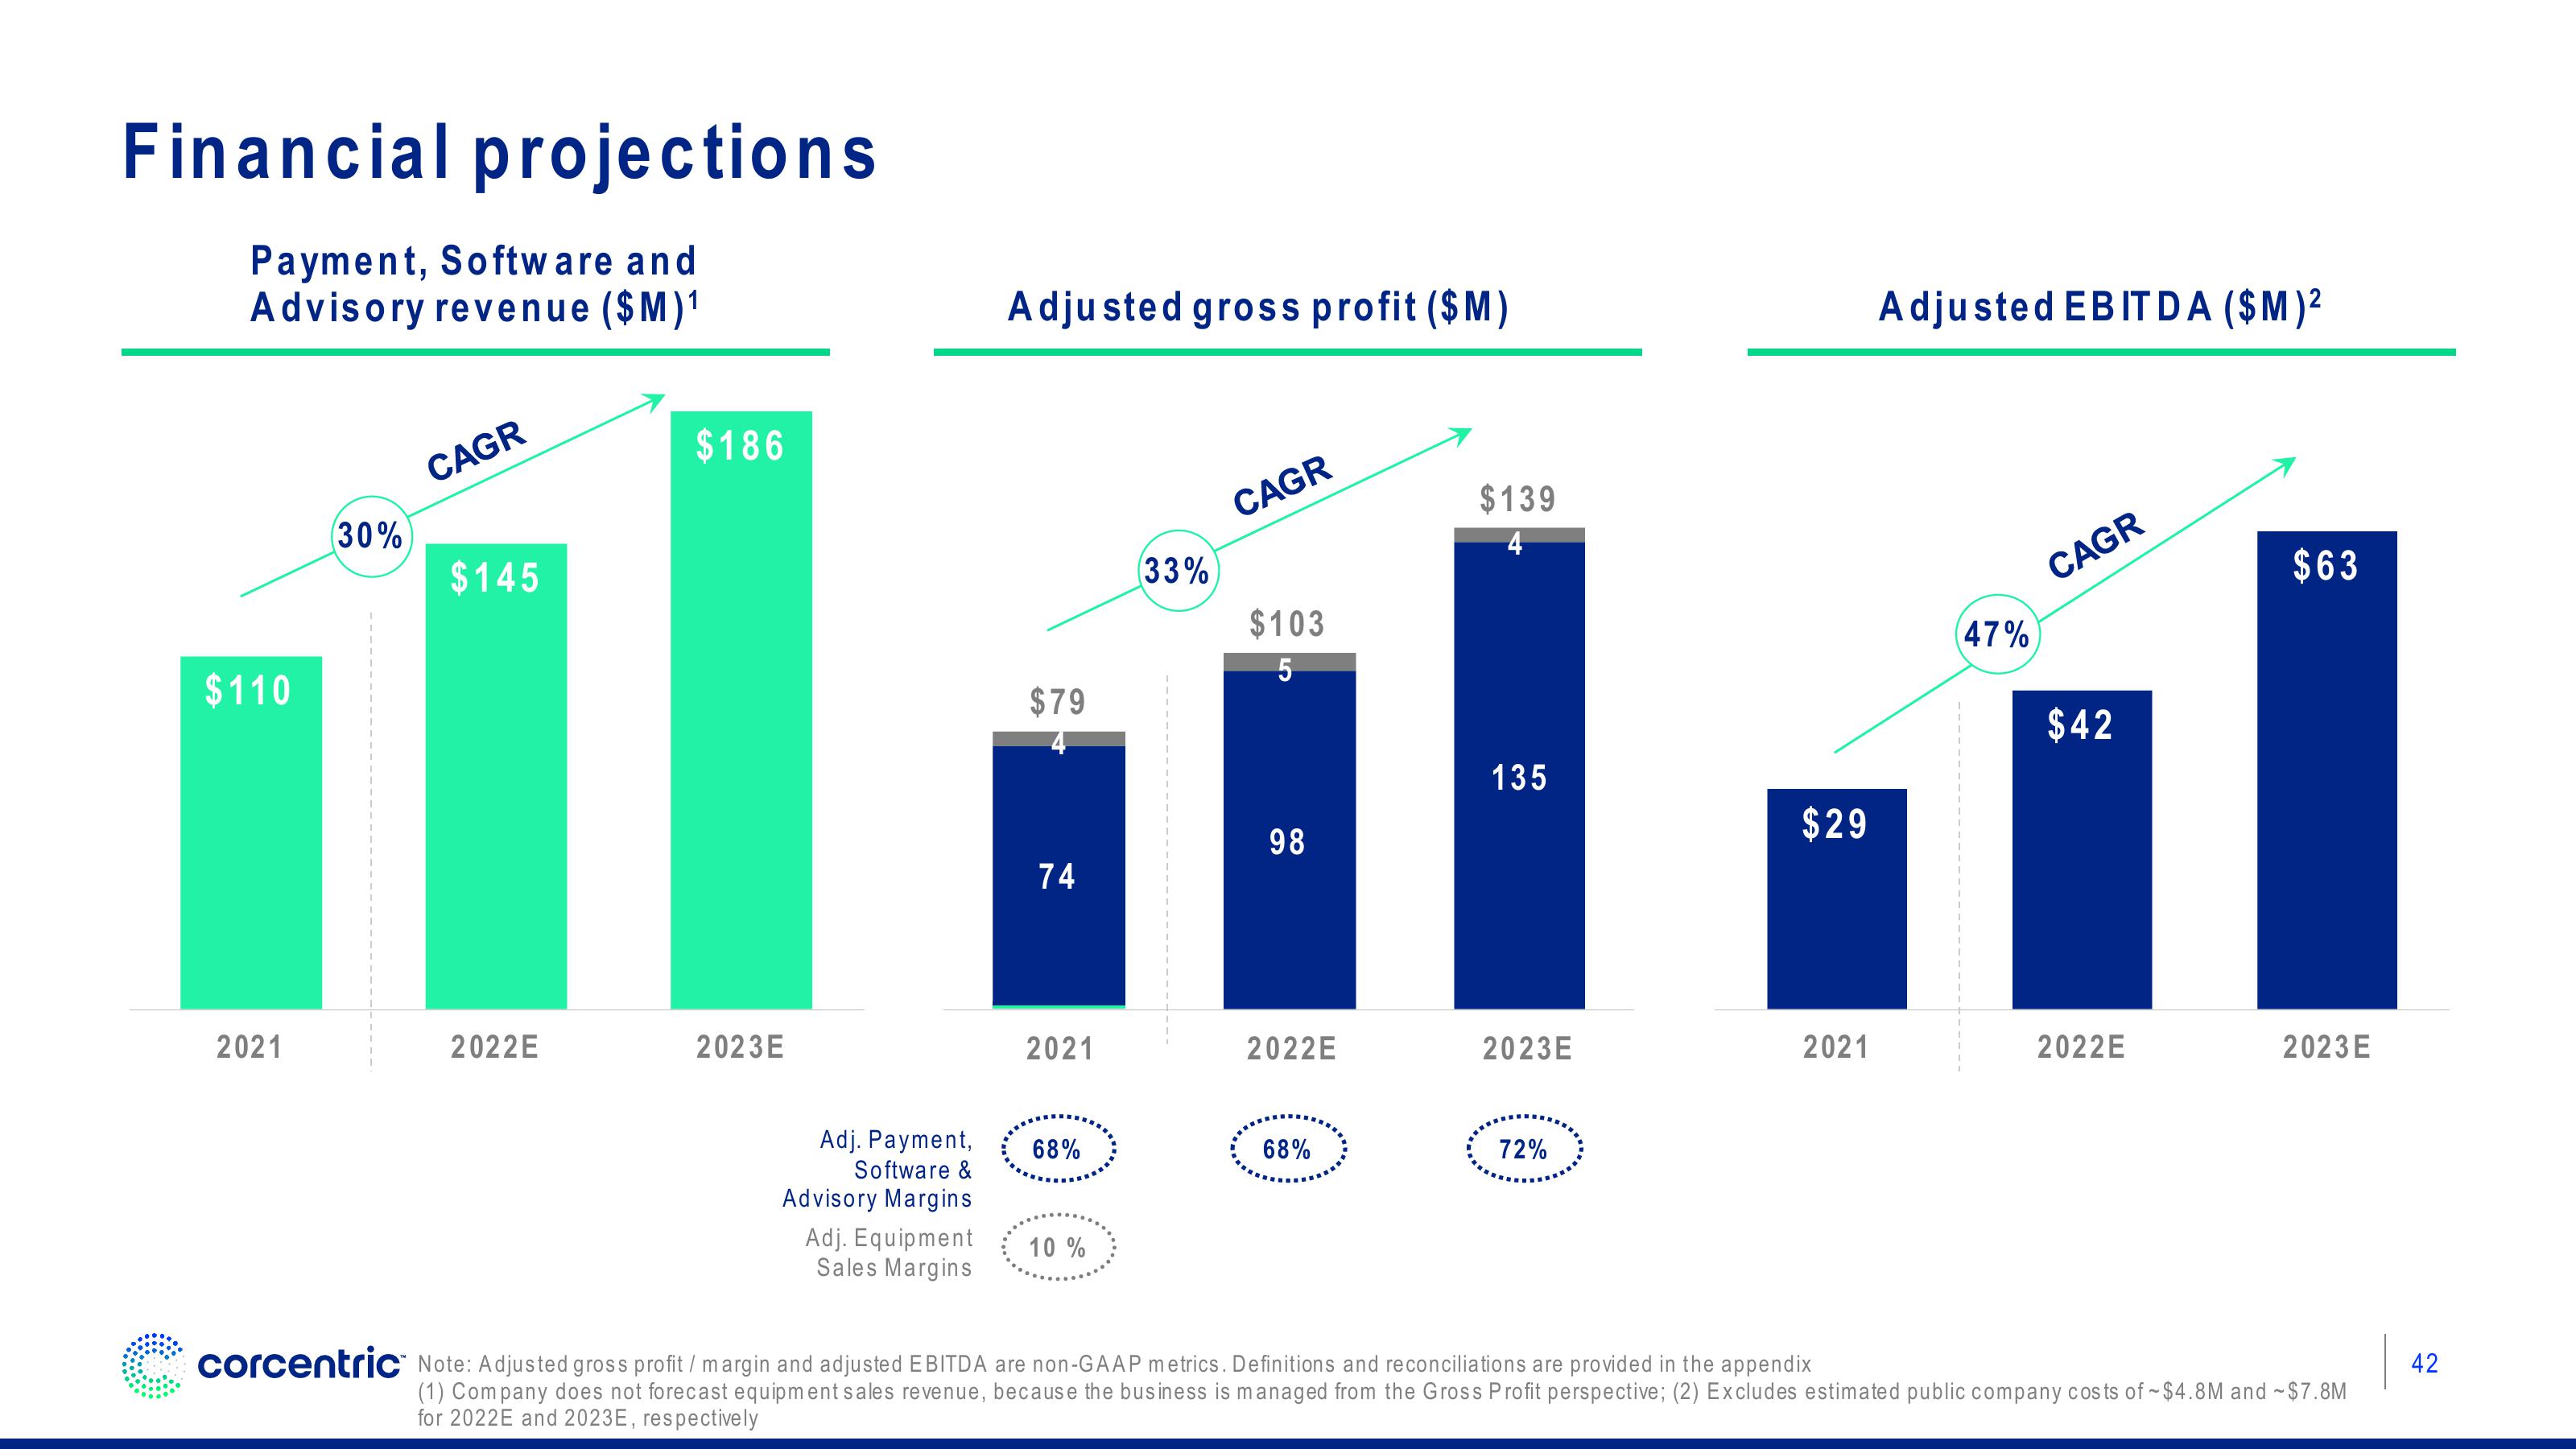
Financial projections Payment, Software and Advisory revenue ($M)¹ $110 2021 30% CAGR $145 2022E $186 2023E Adj. Payment, Software & Advisory Margins Adj. Equipment Sales Margins Adjusted gross profit ($M) $79 74 2021 68% 10 % 33% CAGR $103 5 98 2022E 68% $139 4 135 2023E 72% $29 2021 corcentric Note: Adjusted gross profit / margin and adjusted EBITDA are non-GAAP metrics. Definitions and reconciliations are provided in the appendix Adjusted EBITDA ($M)² 47% CAGR $42 2022E $63 2023 E (1) Company does not forecast equipment sales revenue, because the business is managed from the Gross Profit perspective; (2) Excludes estimated public company costs of ~$4.8M and ~$7.8M for 2022E and 2023E, respectively 42
View entire presentation