Antofagasta Results Presentation Deck
Production and metals prices
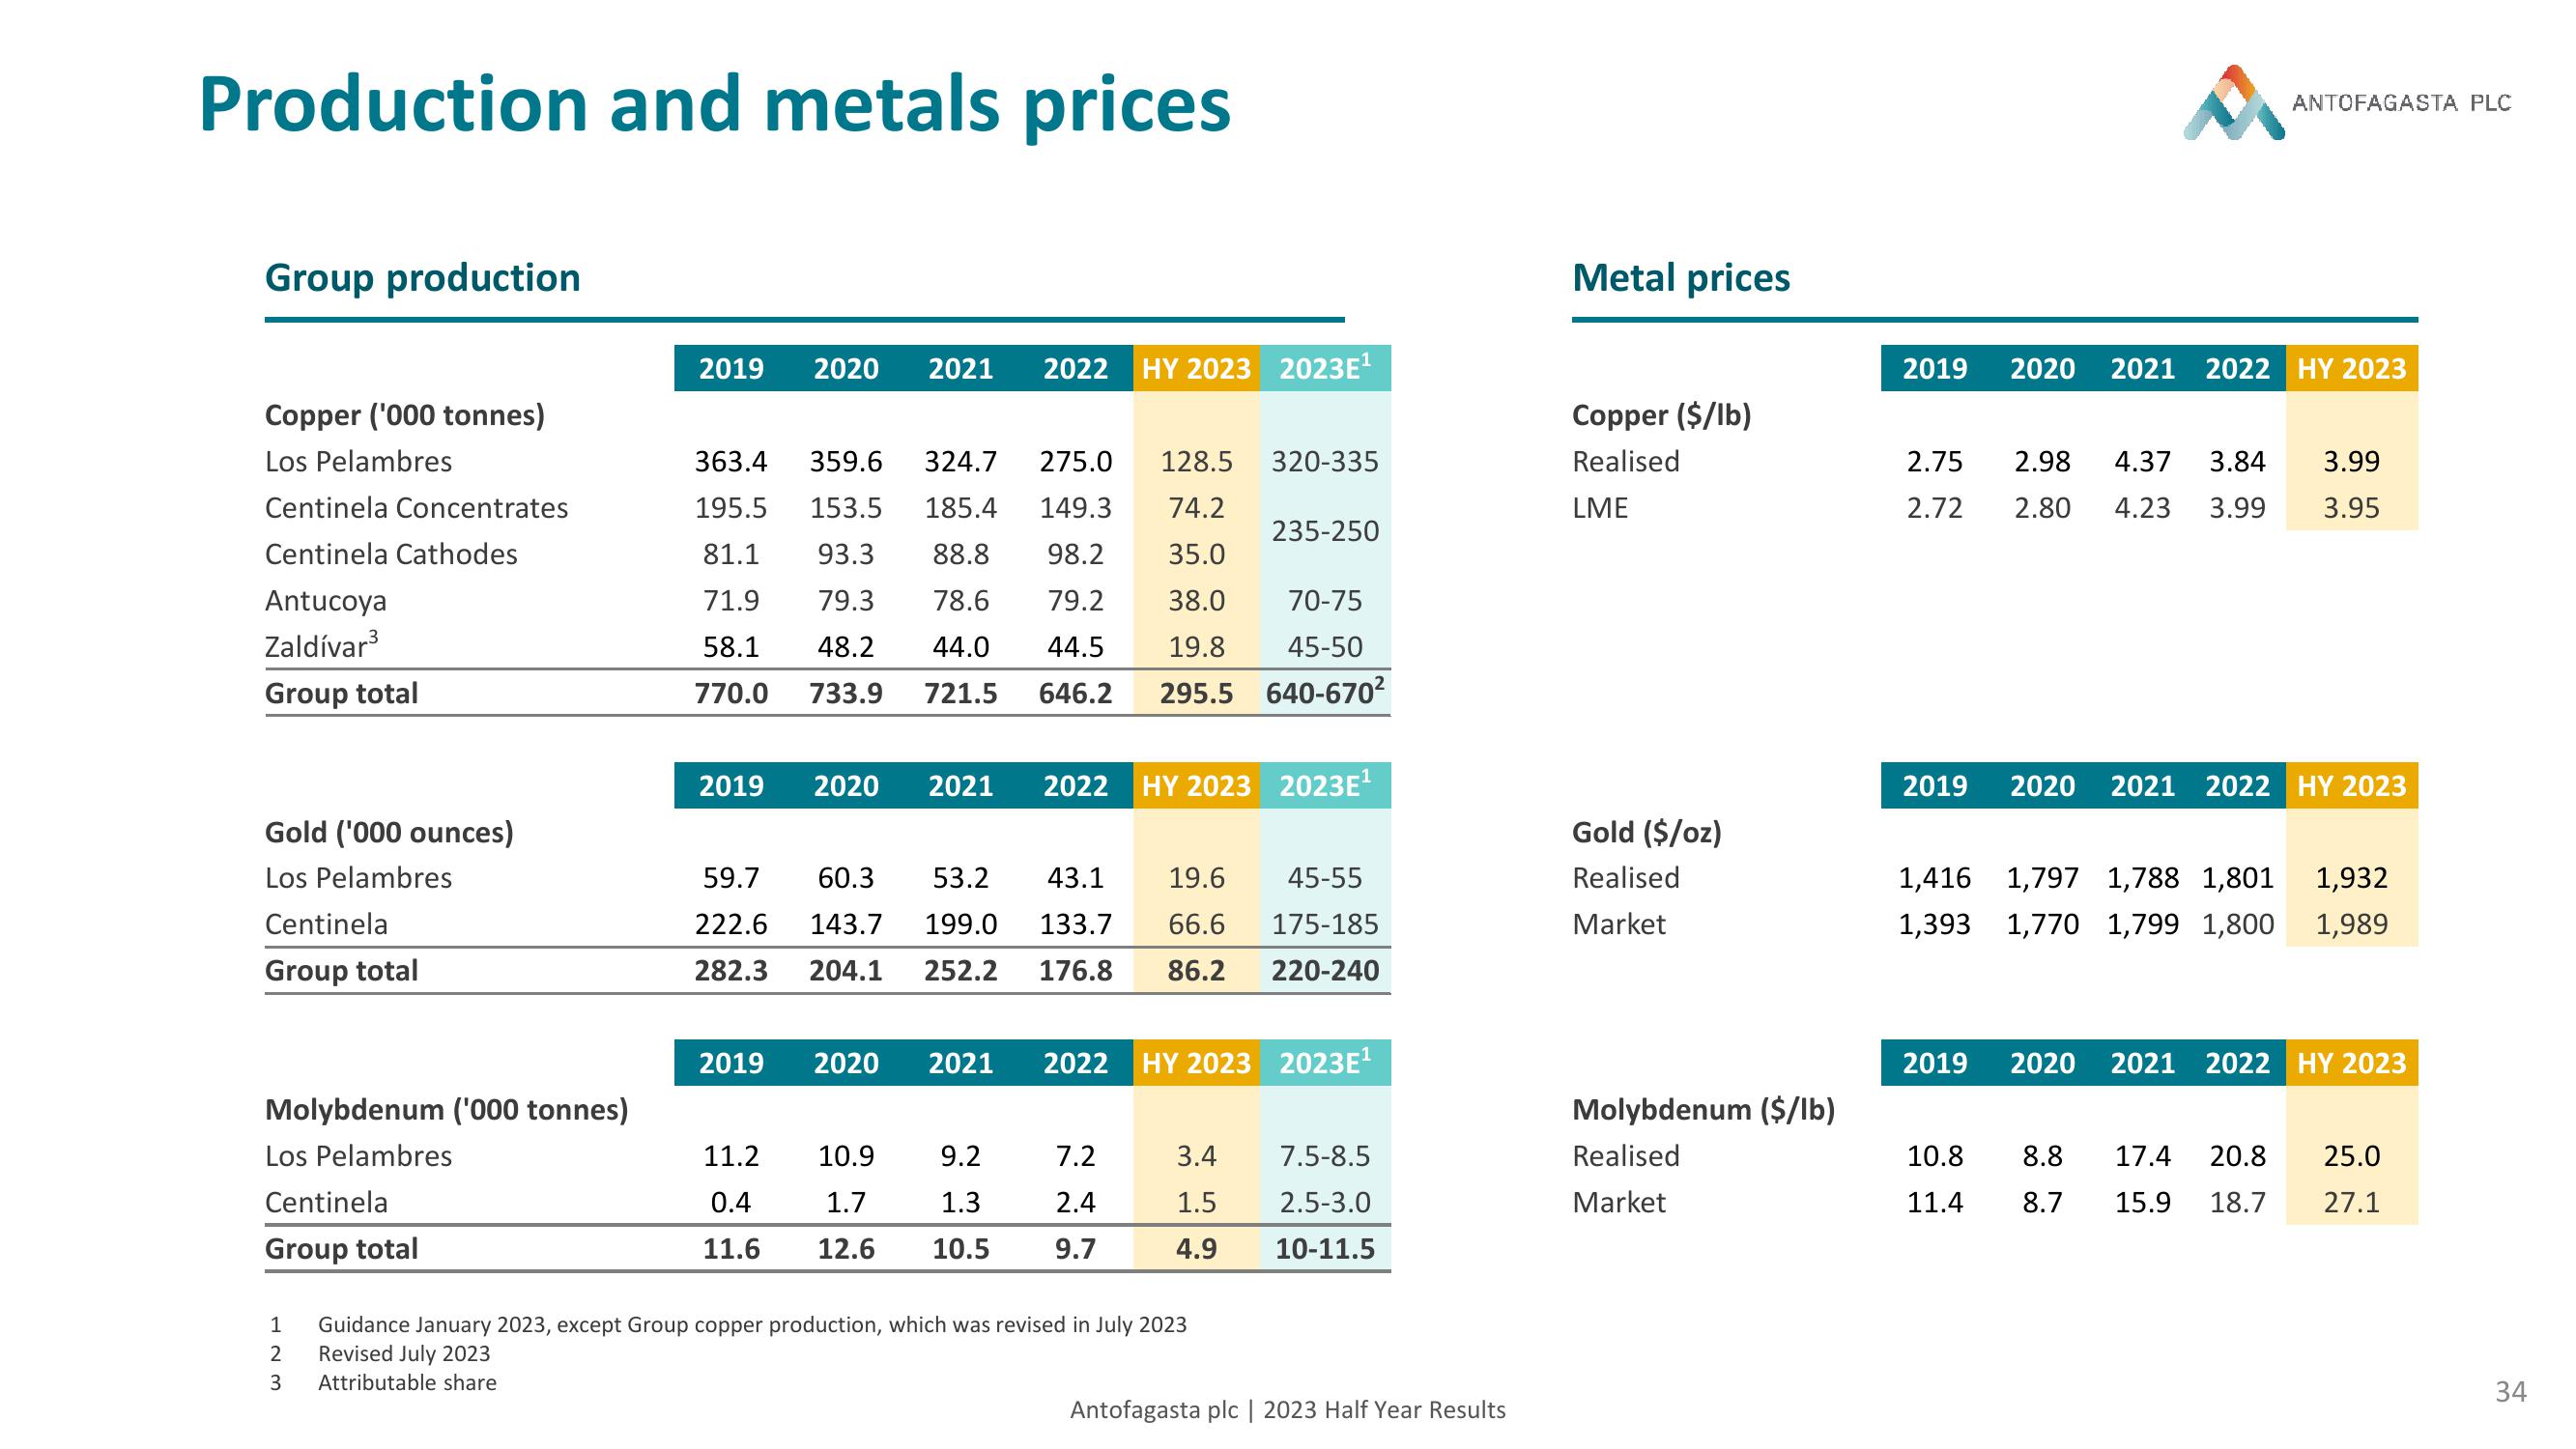
Group production
Copper ('000 tonnes)
Los Pelambres
Centinela Concentrates
Centinela Cathodes
Antucoya
Zaldívar³
Group total
Gold ('000 ounces)
Los Pelambres
Centinela
Group total
Molybdenum ('000 tonnes)
Los Pelambres
Centinela
Group total
2019 2020 2021
363.4 359.6 324.7 275.0 128.5 320-335
195.5 153.5 185.4 149.3 74.2
81.1
71.9
58.1
770.0
93.3 88.8 98.2
79.3 78.6 79.2
48.2 44.0 44.5
733.9 721.5 646.2
35.0
38.0 70-75
19.8 45-50
295.5 640-670²
2019
2019
2020 2021
11.2
0.4
11.6
2022 HY 2023 2023E¹
2020 2021
2022
59.7 60.3 53.2 43.1 19.6 45-55
222.6 143.7 199.0 133.7 66.6 175-185
282.3 204.1 252.2 176.8 86.2 220-240
2022
9.2
7.2
10.9
1.7
1.3
2.4
12.6 10.5 9.7
235-250
HY 2023 2023E¹
HY 2023 2023E¹
3.4
1.5
7.5-8.5
2.5-3.0
4.9 10-11.5
1
Guidance January 2023, except Group copper production, which was revised in July 2023
2
Revised July 2023
3 Attributable share
Antofagasta plc | 2023 Half Year Results
Metal prices
Copper ($/lb)
Realised
LME
Gold ($/oz)
Realised
Market
Molybdenum ($/lb)
Realised
Market
2019 2020
2.75 2.98 4.37 3.84
2.72
2.80 4.23 3.99
2019
2020
2019
2021 2022 HY 2023
2020
ANTOFAGASTA PLC
1,416 1,797 1,788 1,801 1,932
1,393 1,770 1,799 1,800
1,989
3.99
3.95
2021 2022 HY 2023
10.8 8.8 17.4 20.8
11.4 8.7 15.9 18.7
2021 2022 HY 2023
25.0
27.1
34View entire presentation