Pearson Results Presentation Deck
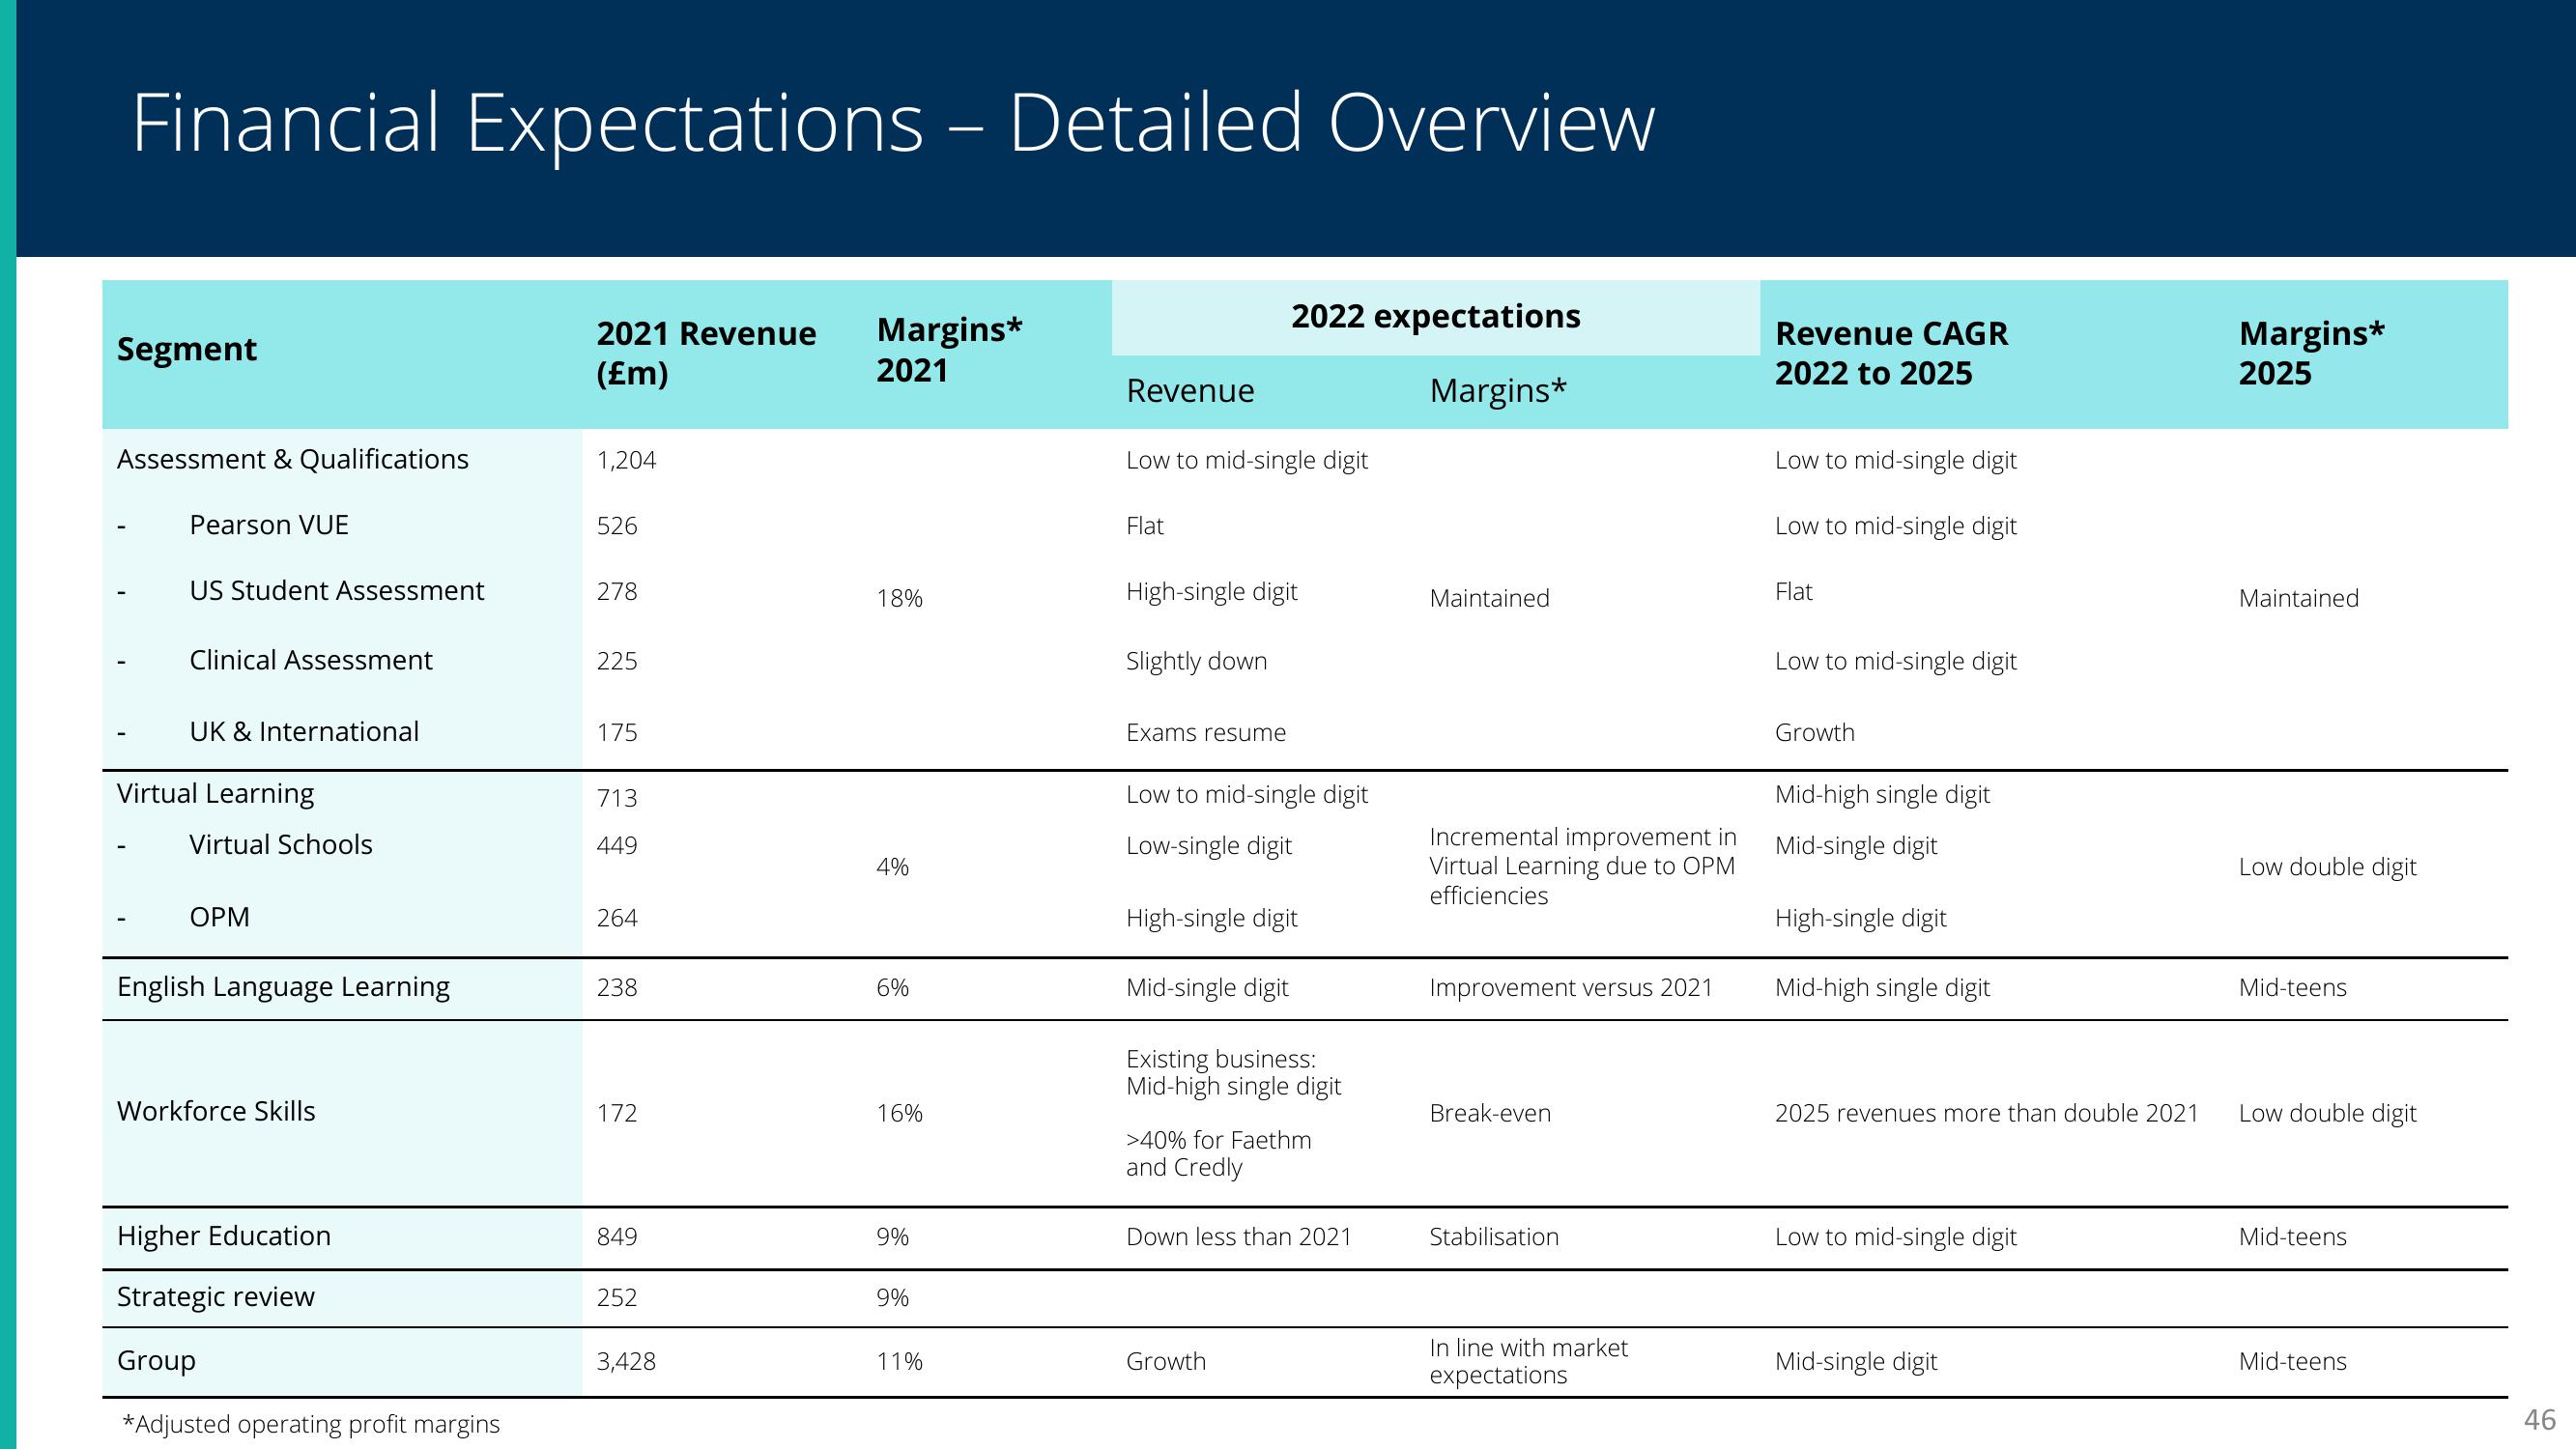
Financial Expectations - Detailed Overview
Segment
Assessment & Qualifications
Pearson VUE
US Student Assessment
Clinical Assessment
UK & International
Virtual Learning
Virtual Schools
OPM
English Language Learning
Workforce Skills
Higher Education
Strategic review
Group
*Adjusted operating profit margins
2021 Revenue Margins*
(£m)
2021
1,204
526
278
225
175
713
449
264
238
172
849
252
3,428
18%
4%
6%
16%
9%
9%
11%
Revenue
Low to mid-single digit
Flat
High-single digit
Slightly down
Exams resume
2022 expectations
Margins*
Low to mid-single digit
Low-single digit
High-single digit
Mid-single digit
Existing business:
Mid-high single digit
>40% for Faethm
and Credly
Down less than 2021
Growth
Maintained
Incremental improvement in
Virtual Learning due to OPM
efficiencies
Improvement versus 2021
Break-even
Stabilisation
In line with market
expectations
Revenue CAGR
2022 to 2025
Low to mid-single digit
Low to mid-single digit
Flat
Low to mid-single digit
Growth
Mid-high single digit
Mid-single digit
High-single digit
Mid-high single digit
2025 revenues more than double 2021
Low to mid-single digit
Mid-single digit
Margins*
2025
Maintained
Low double digit
Mid-teens
Low double digit
Mid-teens
Mid-teens
46View entire presentation