LionTree Investment Banking Pitch Book
Saturn Snapshot
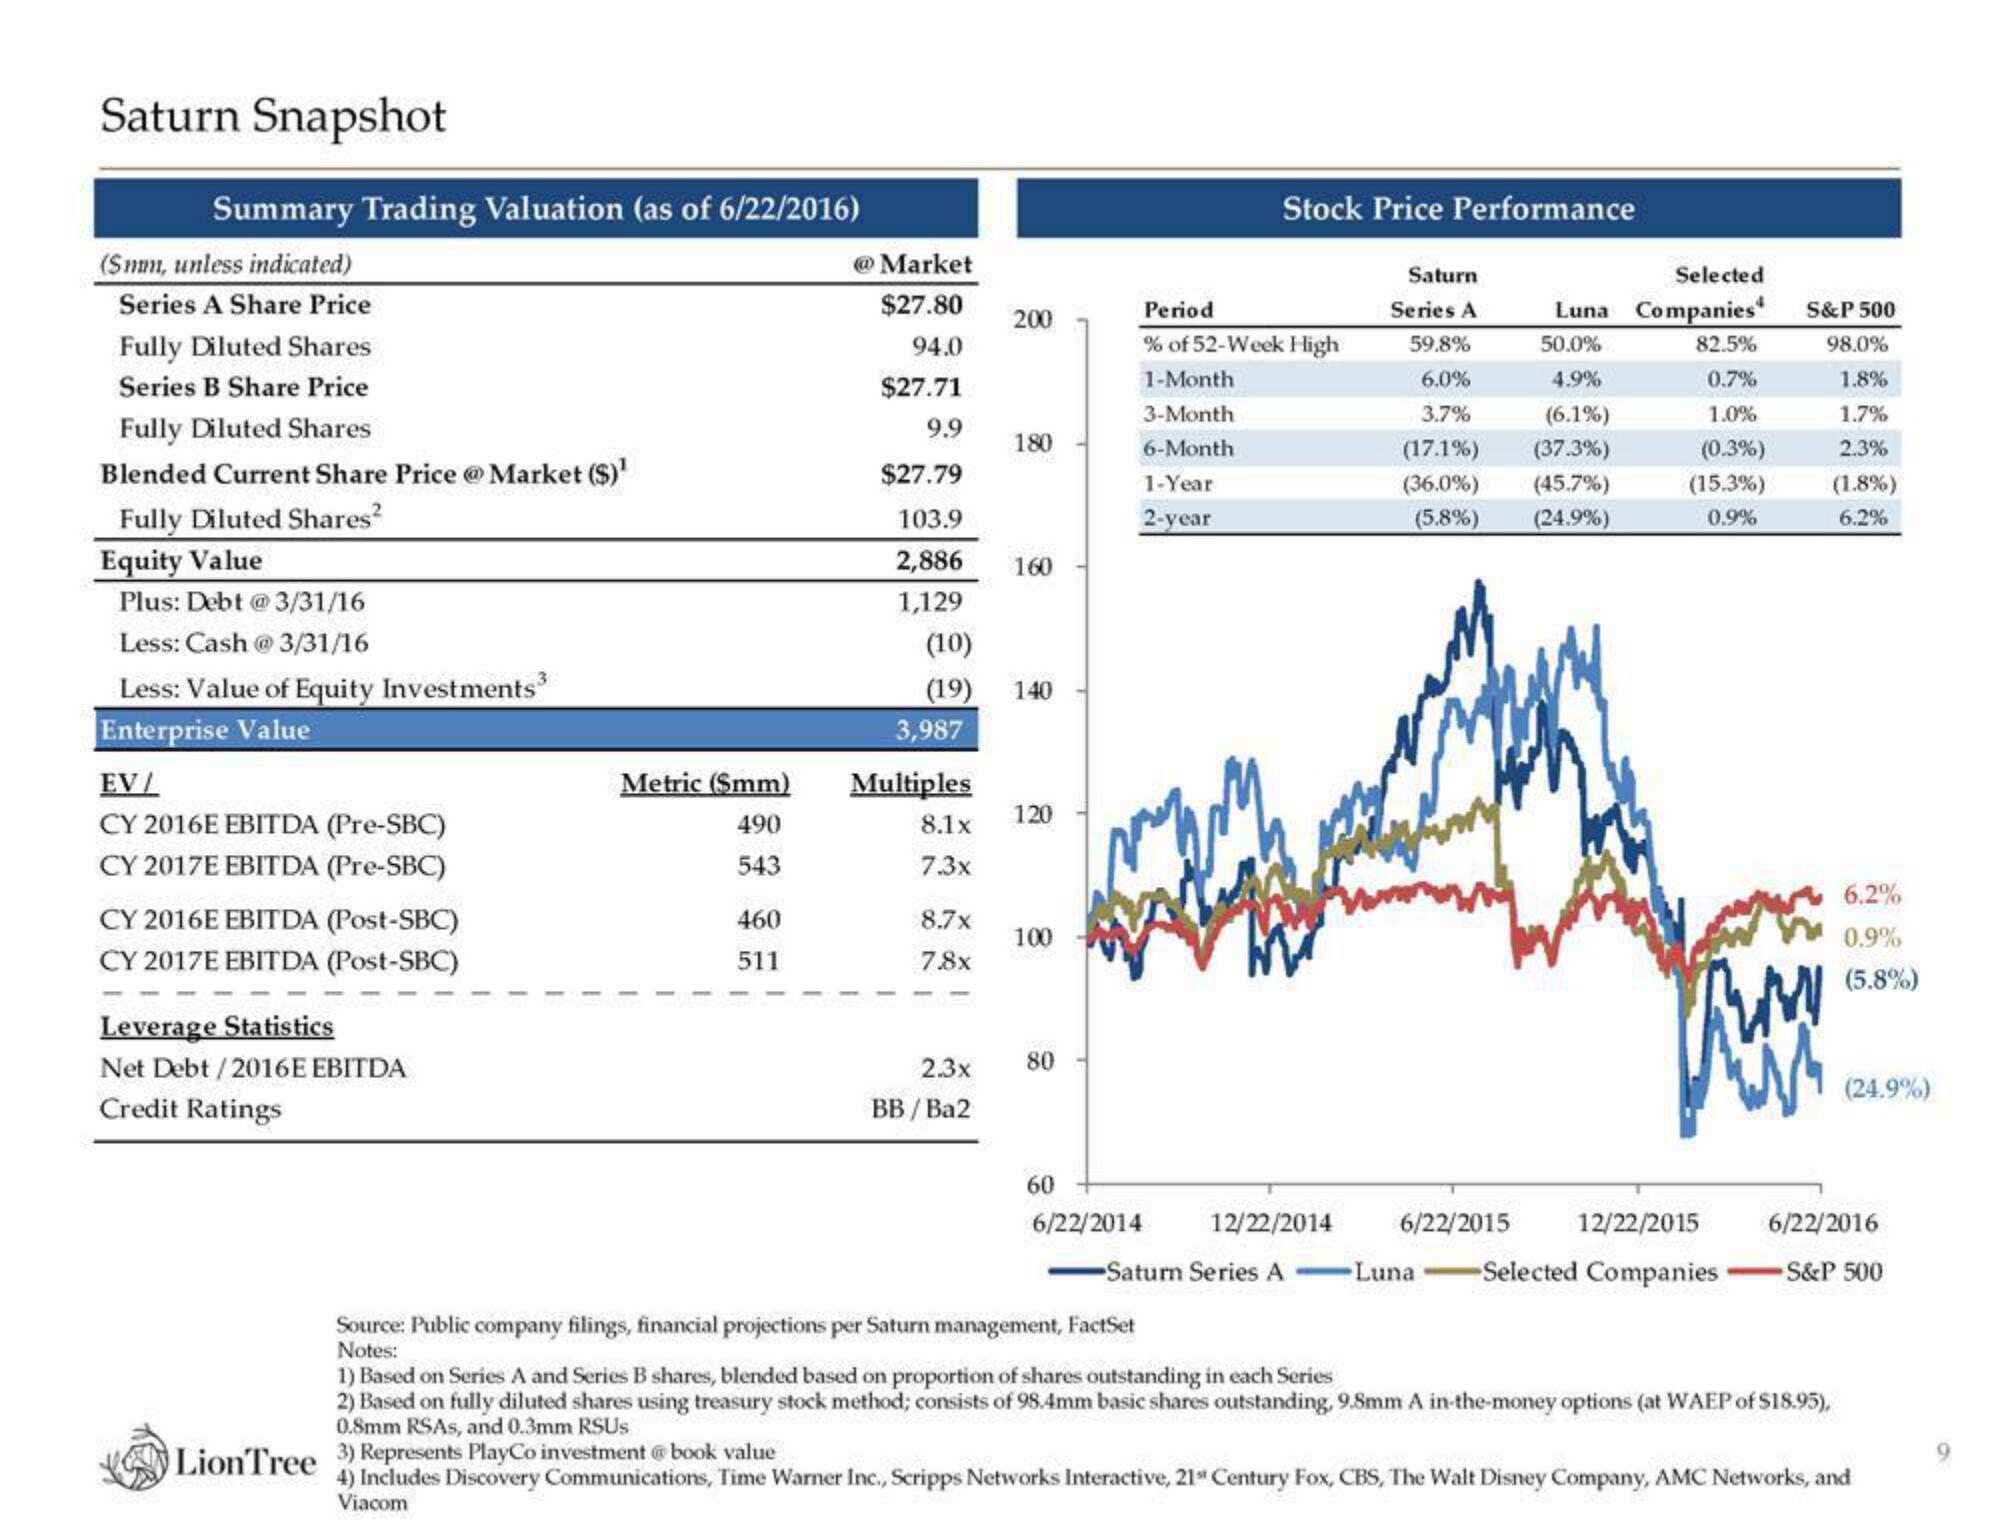
Summary Trading Valuation (as of 6/22/2016)
(Smm, unless indicated)
Series A Share Price
Fully Diluted Shares
Series B Share Price
Fully Diluted Shares
Blended Current Share Price @ Market ($)¹
Fully Diluted Shares²
Equity Value
Plus: Debt @ 3/31/16
Less: Cash @ 3/31/16
Less: Value of Equity Investments
Enterprise Value
EV/
CY 2016E EBITDA (Pre-SBC)
CY 2017E EBITDA (Pre-SBC)
CY 2016E EBITDA (Post-SBC)
CY 2017E EBITDA (Post-SBC)
Leverage Statistics
Net Debt/2016E EBITDA
Credit Ratings
Lion Tree
3
Metric (Smm)
490
543
460
511
@Market
$27.80
94.0
$27.71
9.9
$27.79
103.9
2,886
1,129
3,987
Multiples
8.1x
7.3x
8.7x
7.8x
200
(10)
(19) 140
2.3x
BB/Ba2
180
160
120
100
80
60
6/22/2014
Stock Price Performance
Period
% of 52-Week High
1-Month
3-Month
6-Month
1-Year
2-year
12/22/2014
-Saturn Series A
Source: Public company filings, financial projections per Saturn management, FactSet
Notes:
Saturn
Series A
59.8%
6.0%
3.7%
(17.1%)
(36.0%)
(5.8%)
Selected
Luna Companies
50.0%
4.9%
Luna
(6.1%)
(37.3%)
(45.7%)
(24.9%)
82.5%
0.7%
1.0%
(0.3%)
(15.3%)
0.9%
6/22/2015 12/22/2015
Selected Companies
S&P 500
98.0%
1.8%
1.7%
2.3%
(1.8%)
6.2%
www
6.2%
0.9%
(5.8%)
1) Based on Series A and Series B shares, blended based on proportion of shares outstanding in each Series
2) Based on fully diluted shares using treasury stock method; consists of 98.4mm basic shares outstanding, 9.8mm A in-the-money options (at WAEP of $18.95),
0.8mm RSAs, and 0.3mm RSUs
(24.9%)
6/22/2016
- S&P 500
3) Represents PlayCo investment @book value
4) Includes Discovery Communications, Time Warner Inc., Scripps Networks Interactive, 21st Century Fox, CBS, The Walt Disney Company, AMC Networks, and
ViacomView entire presentation