Hexagon Purus Results Presentation Deck
34
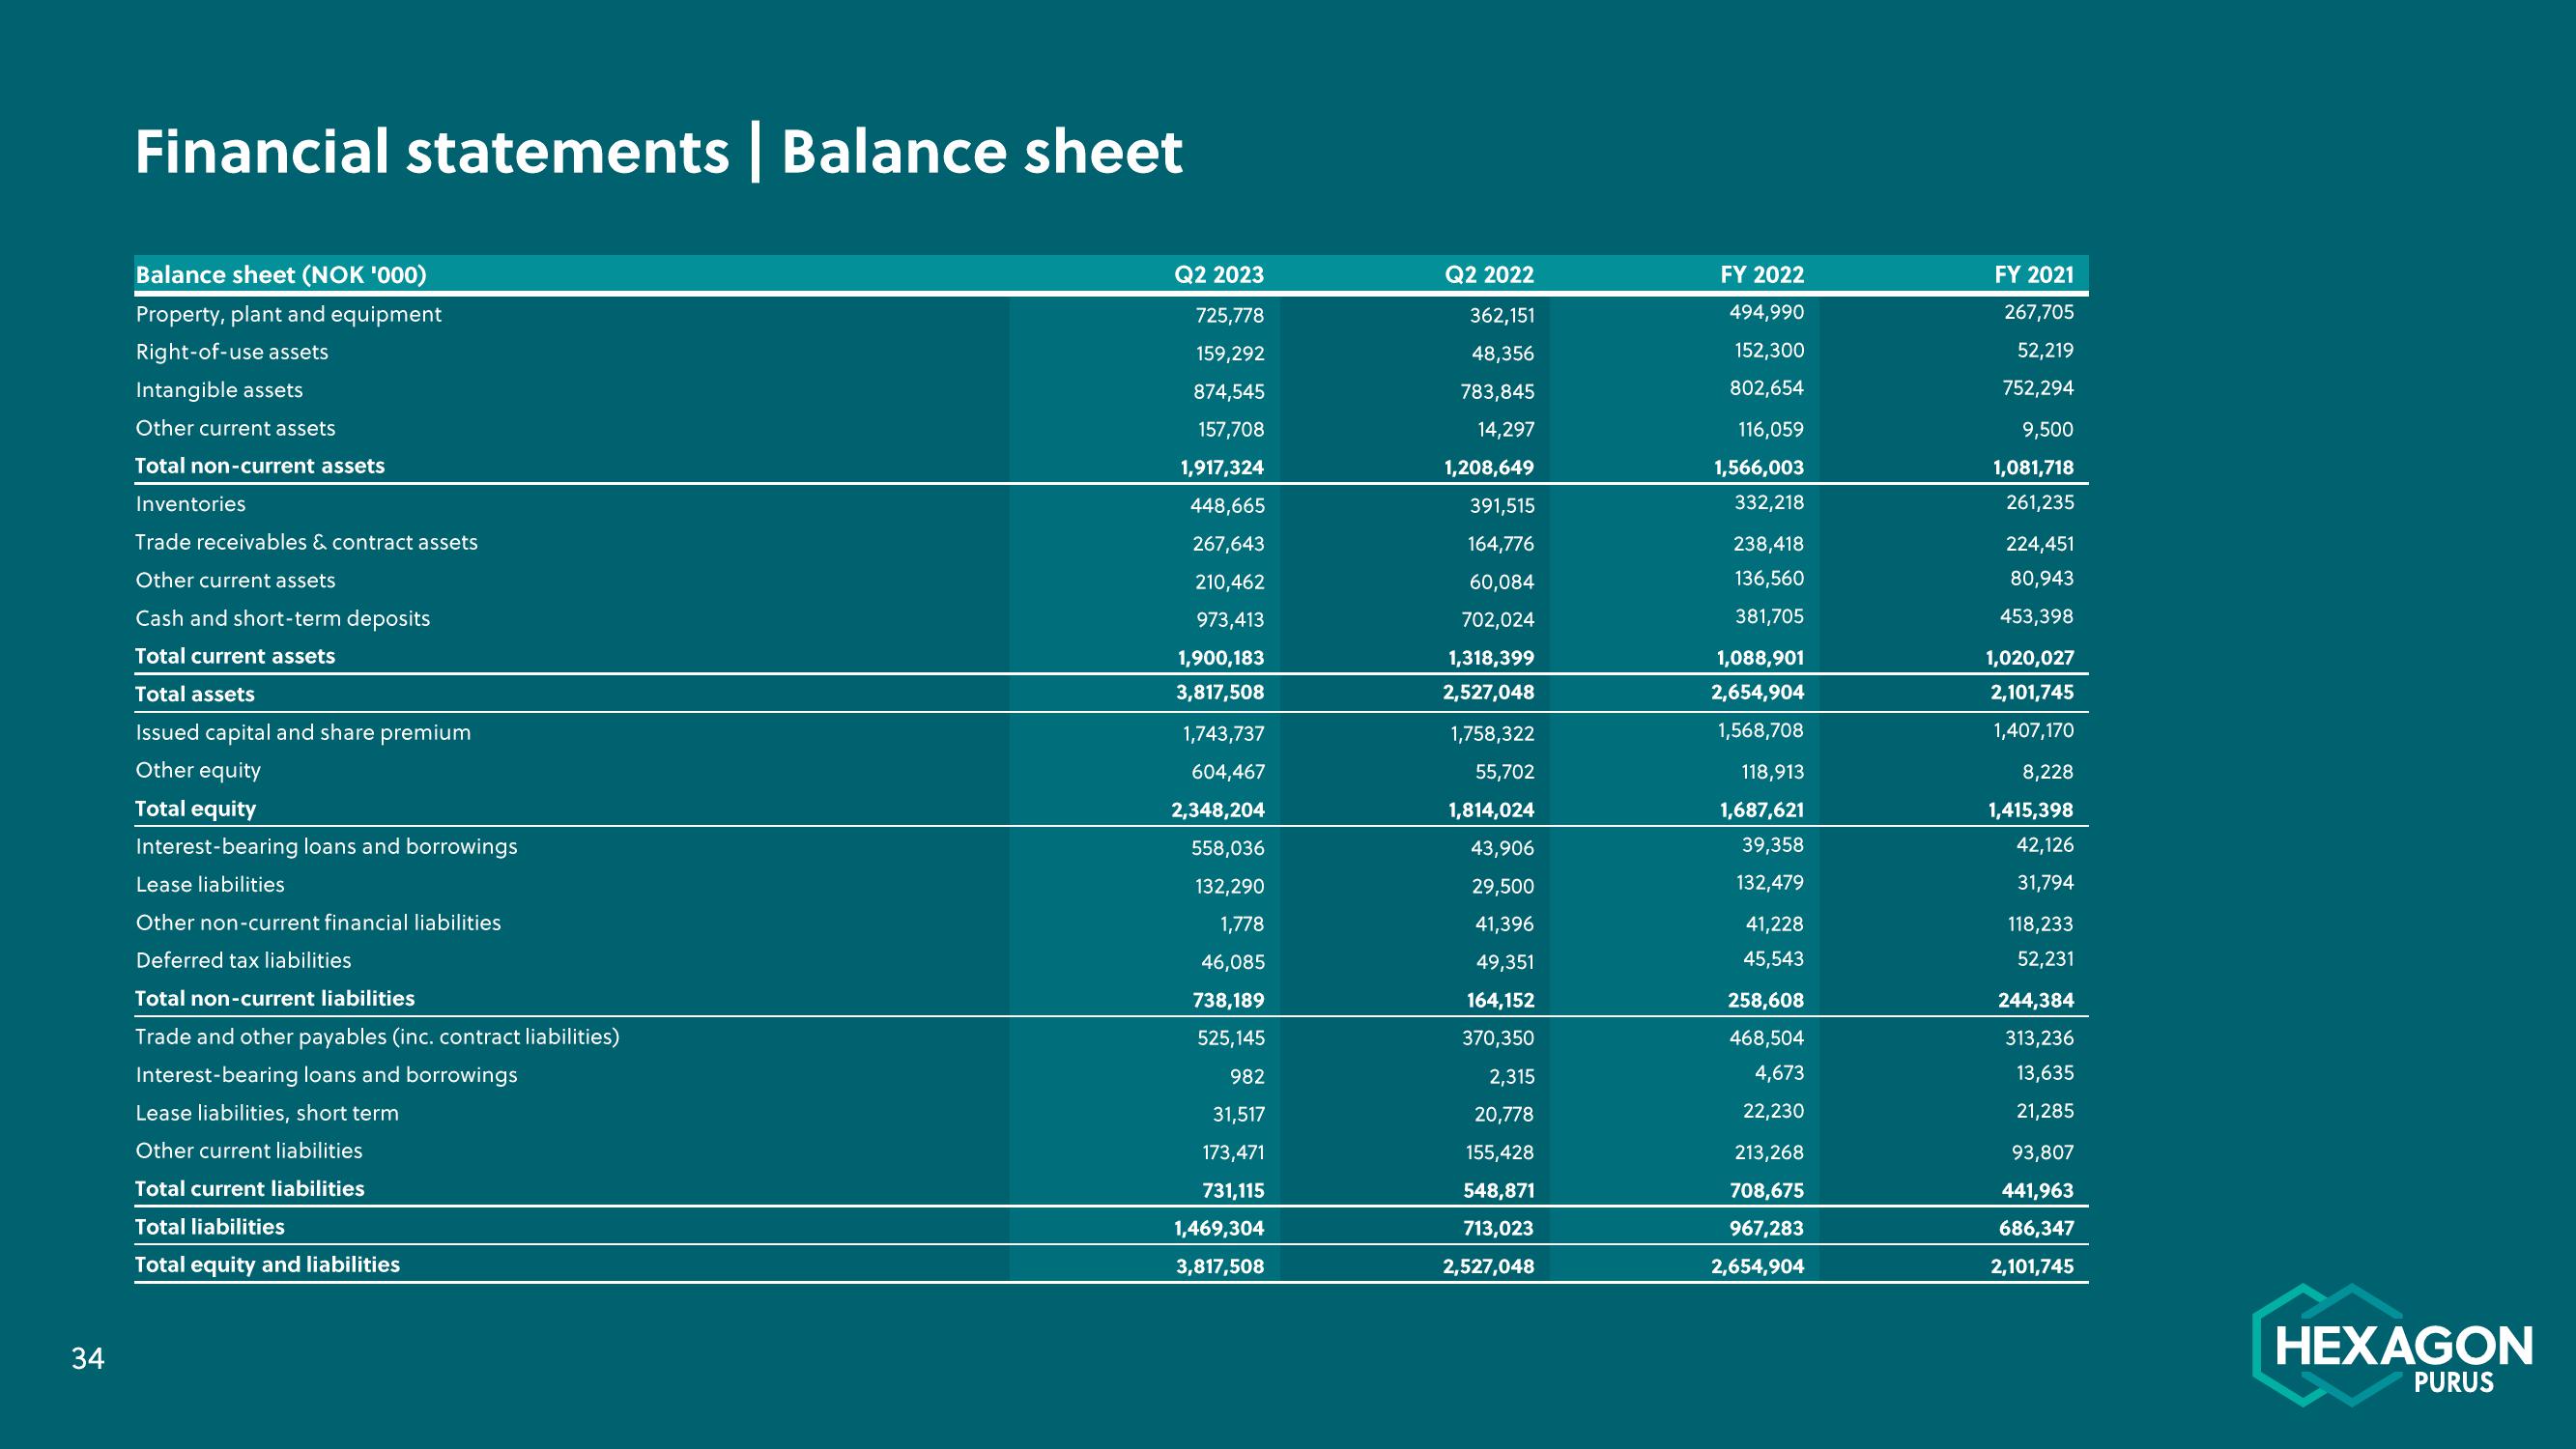
Financial statements | Balance sheet
Balance sheet (NOK '000)
Property, plant and equipment
Right-of-use assets
Intangible assets
Other current assets
Total non-current assets
Inventories
Trade receivables & contract assets
Other current assets
Cash and short-term deposits
Total current assets
Total assets
Issued capital and share premium
Other equity
Total equity
Interest-bearing loans and borrowings
Lease liabilities
Other non-current financial liabilities
Deferred tax liabilities
Total non-current liabilities
Trade and other payables (inc. contract liabilities)
Interest-bearing loans and borrowings
Lease liabilities, short term
Other current liabilities
Total current liabilities
Total liabilities
Total equity and liabilities
Q2 2023
725,778
159,292
874,545
157,708
1,917,324
448,665
267,643
210,462
973,413
1,900,183
3,817,508
1,743,737
604,467
2,348,204
558,036
132,290
1,778
46,085
738,189
525,145
982
31,517
173,471
731,115
1,469,304
3,817,508
Q2 2022
362,151
48,356
783,845
14,297
1,208,649
391,515
164,776
60,084
702,024
1,318,399
2,527,048
1,758,322
55,702
1,814,024
43,906
29,500
41,396
49,351
164,152
370,350
2,315
20,778
155,428
548,871
713,023
2,527,048
FY 2022
494,990
152,300
802,654
116,059
1,566,003
332,218
238,418
136,560
381,705
1,088,901
2,654,904
1,568,708
118,913
1,687,621
39,358
132,479
41,228
45,543
258,608
468,504
4,673
22,230
213,268
708,675
967,283
2,654,904
FY 2021
267,705
52,219
752,294
9,500
1,081,718
261,235
224,451
80,943
453,398
1,020,027
2,101,745
1,407,170
8,228
1,415,398
42,126
31,794
118,233
52,231
244,384
313,236
13,635
21,285
93,807
441,963
686,347
2,101,745
HEXAGON
PURUSView entire presentation