OpenText Results Presentation Deck
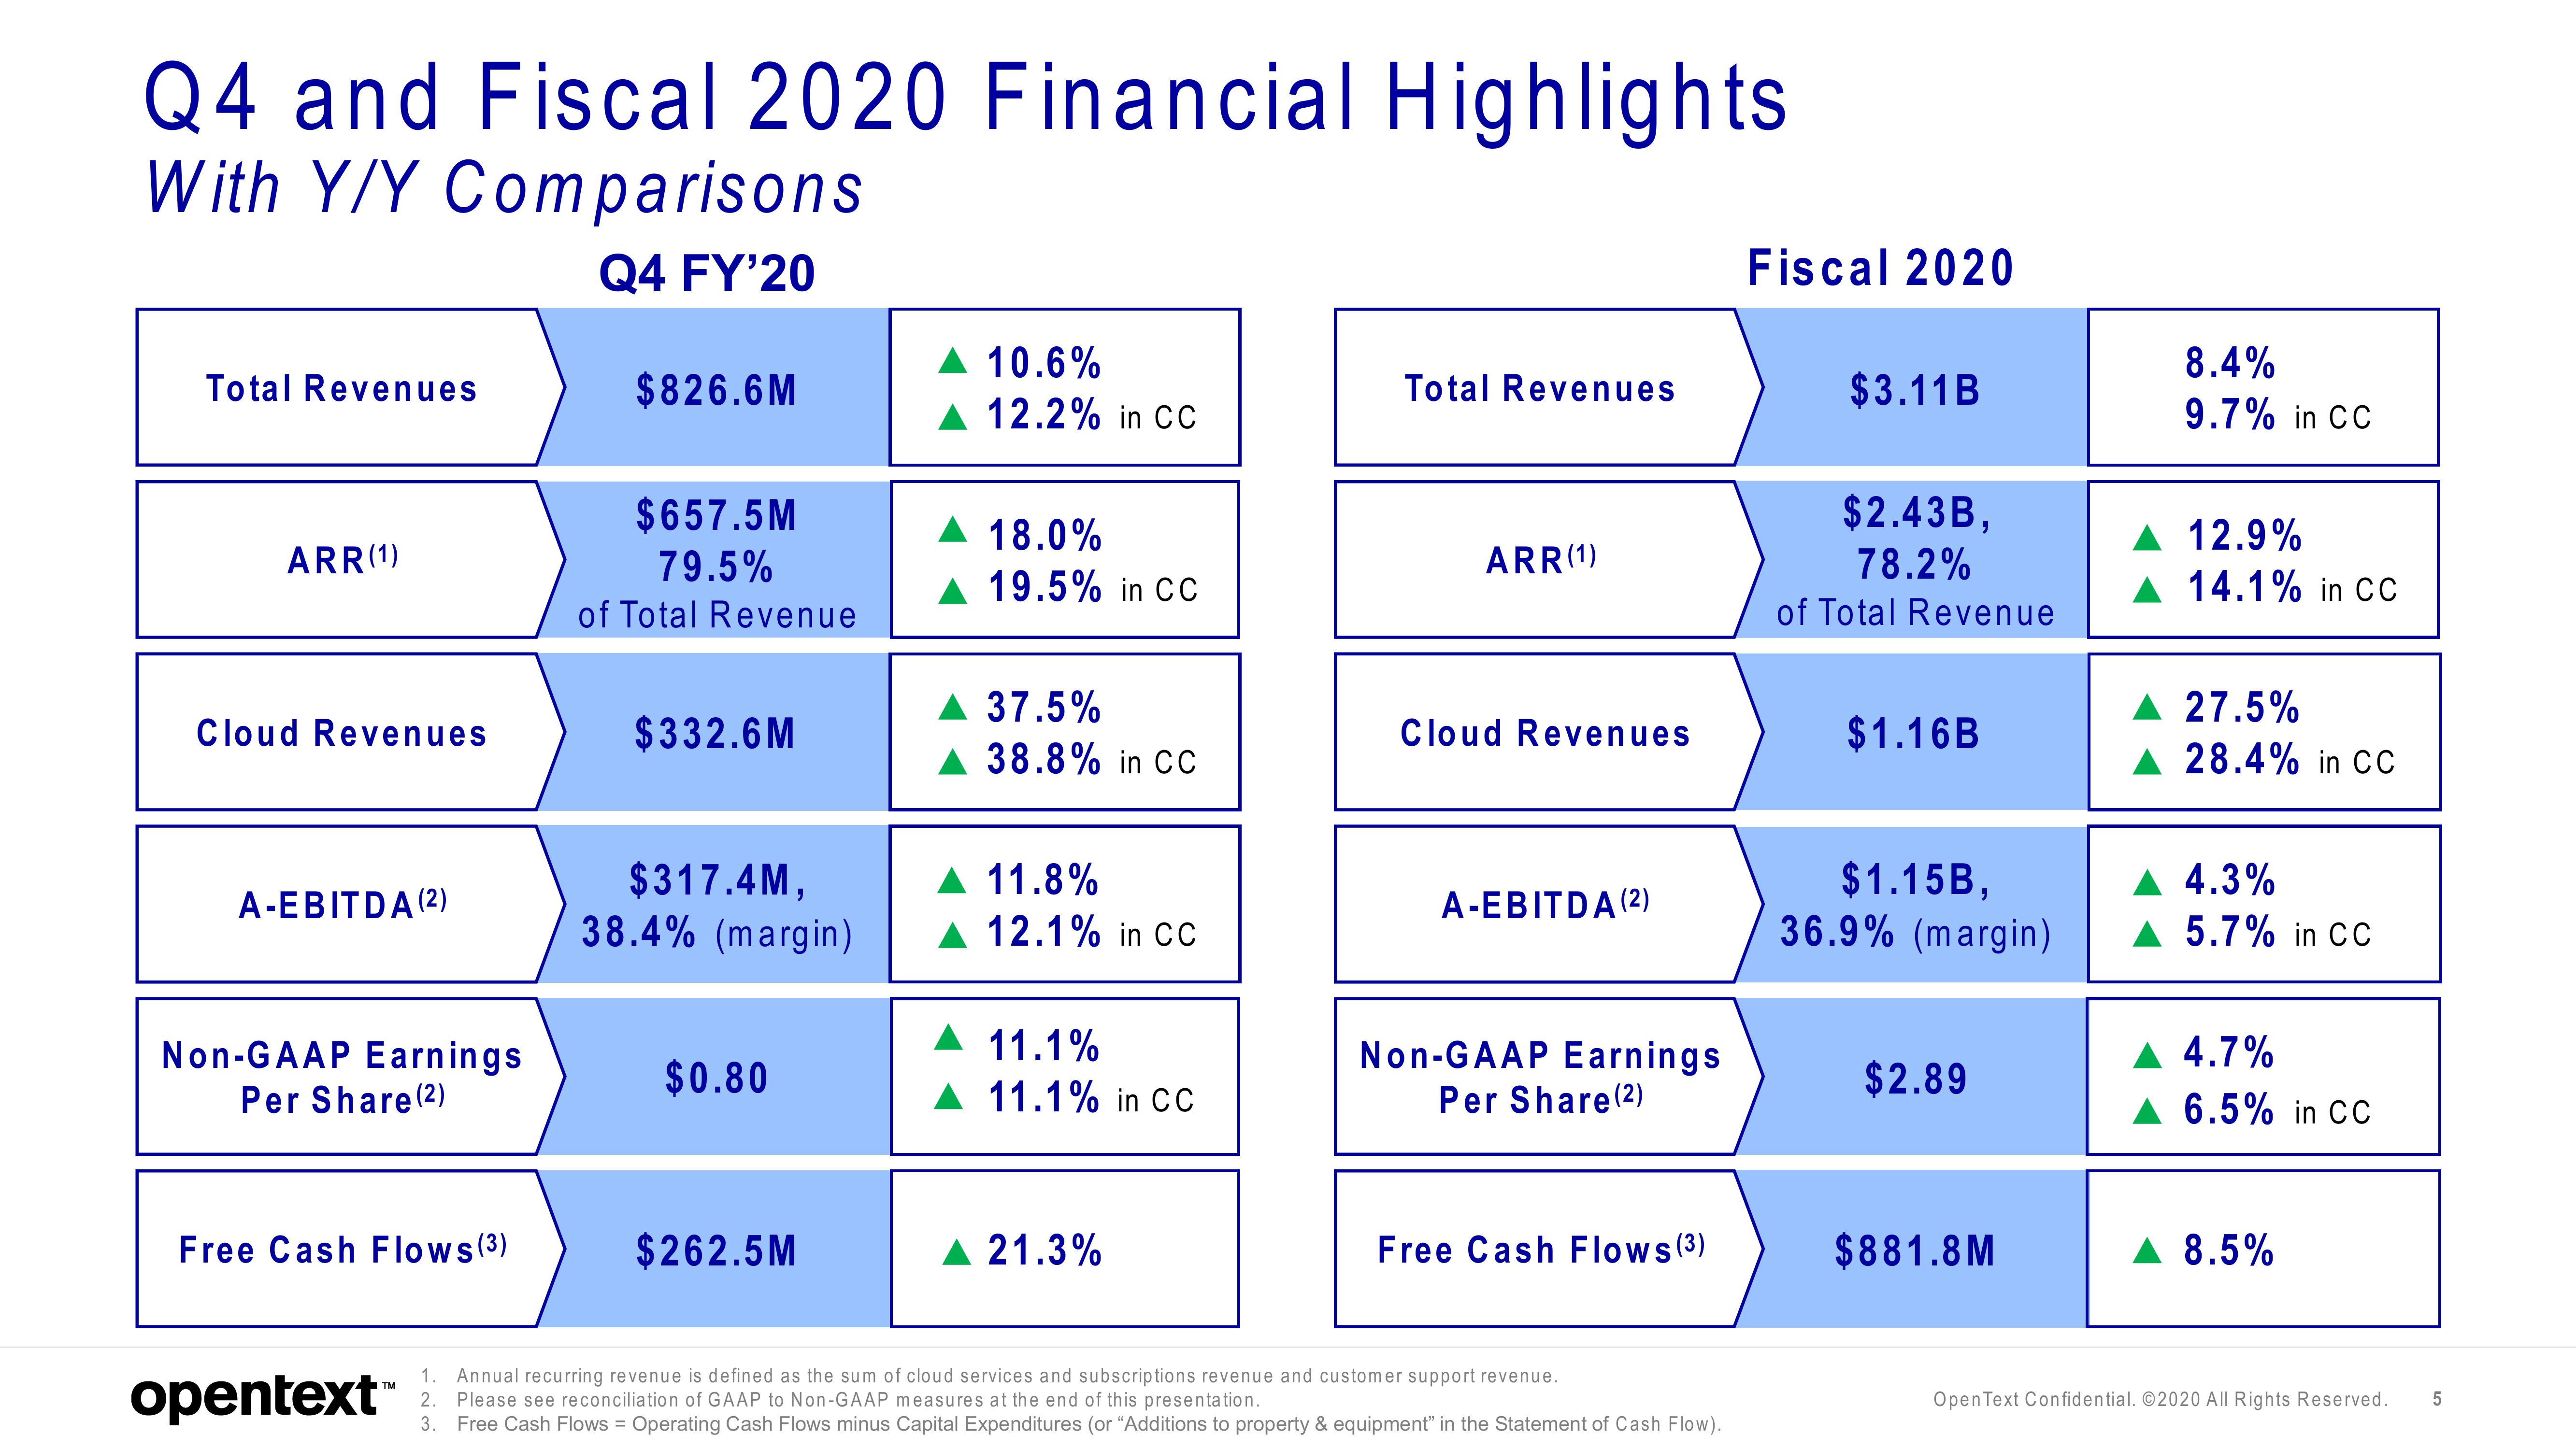
Q4 and Fiscal 2020 Financial Highlights
With Y/Y Comparisons
Q4 FY'20
Total Revenues
ARR(1)
Cloud Revenues
A-EBITDA (2)
Non-GAAP Earnings
Per Share (2)
Free Cash Flows (³)
opentext™
$826.6M
$657.5M
79.5%
of Total Revenue
$332.6M
$317.4M,
38.4% (margin)
$0.80
$262.5M
10.6%
12.2% in CC
18.0%
19.5% in CC
37.5%
38.8% in CC
11.8%
12.1% in CC
11.1%
11.1% in CC
21.3%
Total Revenues
ARR(1)
Cloud Revenues
A-EBITDA (²)
Non-GAAP Earnings
Per Share (2)
Free Cash Flows (3)
1. Annual recurring revenue is defined as the sum of cloud services and subscriptions revenue and customer support revenue.
2. Please see reconciliation of GAAP to Non-GAAP measures at the end of this presentation.
3.
Free Cash Flows = Operating Cash Flows minus Capital Expenditures (or "Additions to property & equipment" in the Statement of Cash Flow).
Fiscal 2020
$3.11B
$2.43B,
78.2%
of Total Revenue
$1.16B
$1.15B,
36.9% (margin)
$2.89
$881.8M
8.4%
9.7% in CC
12.9%
14.1% in CC
27.5%
28.4% in CC
4.3%
5.7% in CC
4.7%
6.5% in CC
▲ 8.5%
Open Text Confidential. ©2020 All Rights Reserved. 5View entire presentation