Baird Investment Banking Pitch Book
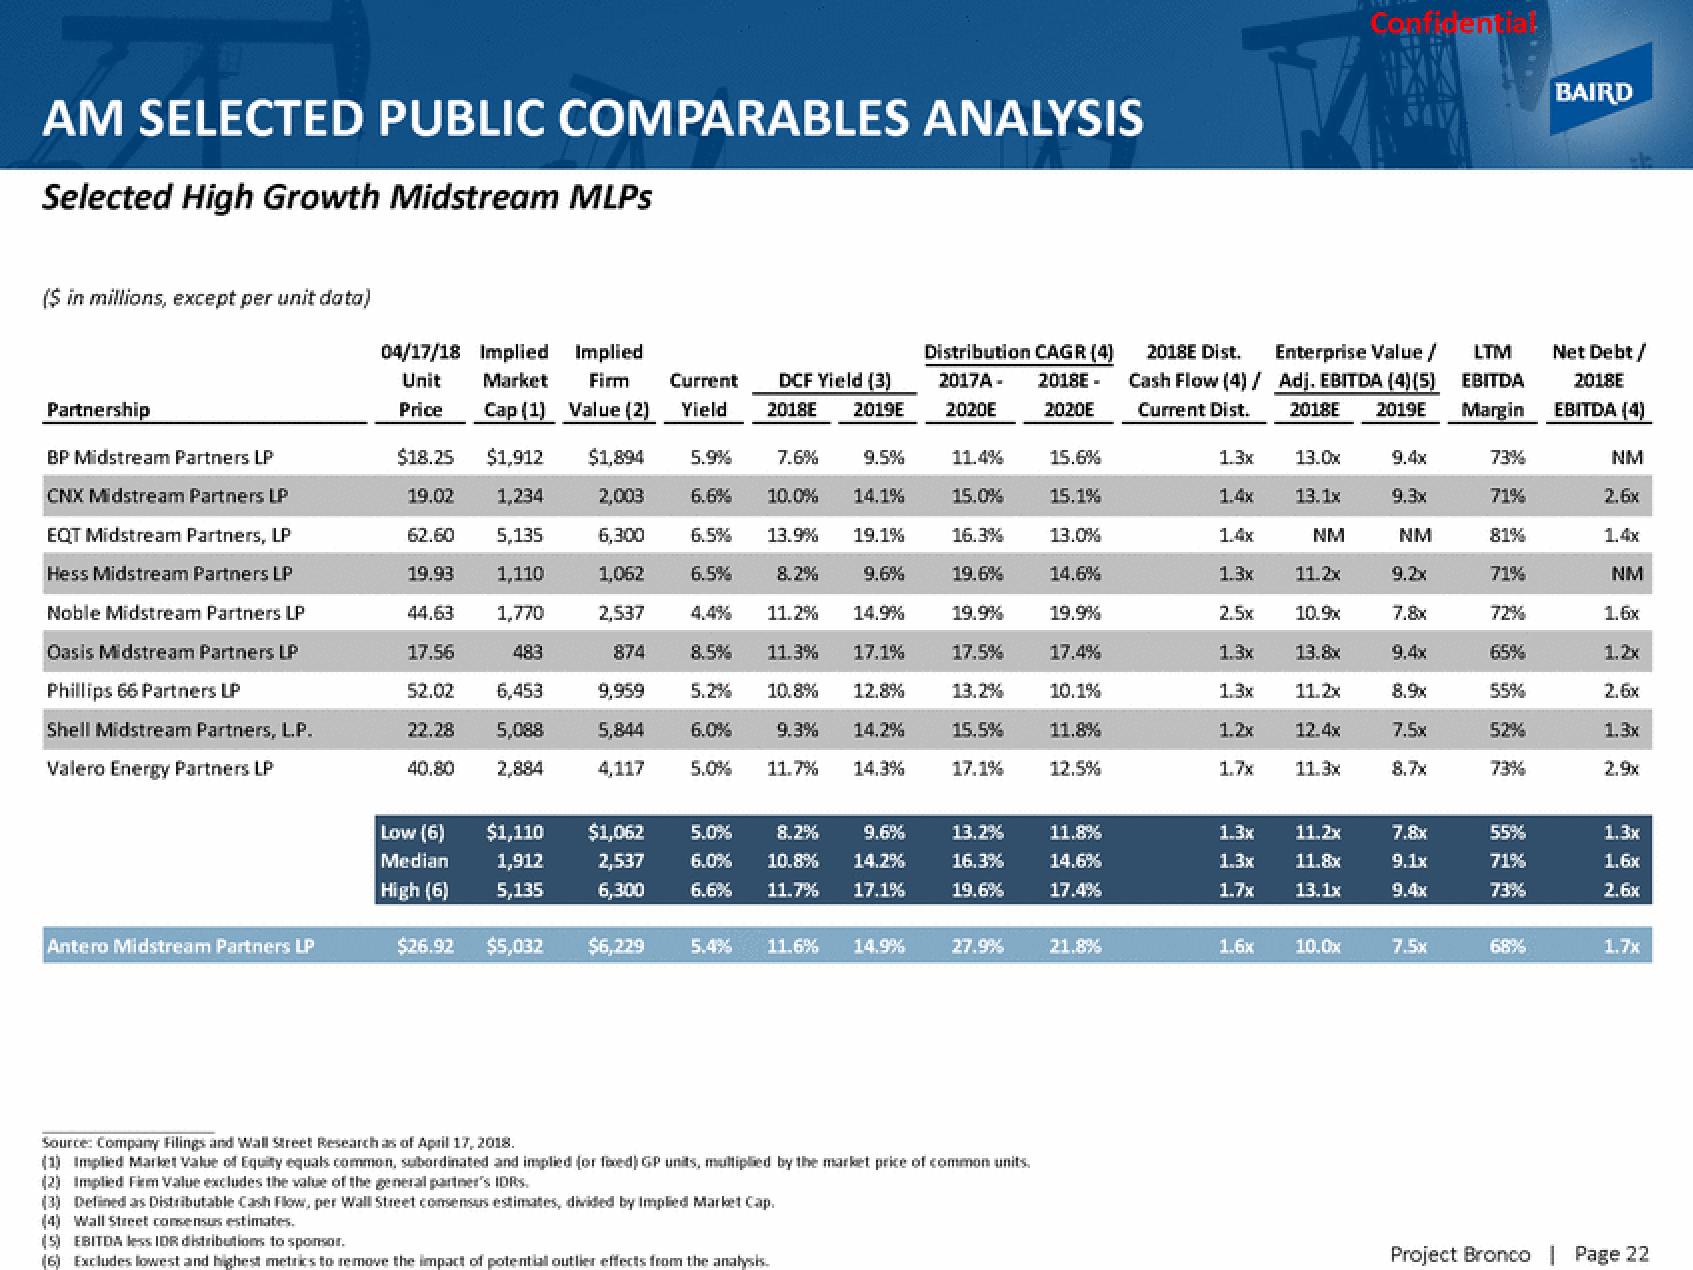
AM SELECTED PUBLIC COMPARABLES ANALYSIS
Selected High Growth Midstream MLPS
($ in millions, except per unit data)
Partnership
BP Midstream Partners LP
CNX Midstream Partners LP
EQT Midstream Partners, LP
Hess Midstream Partners LP
Noble Midstream Partners LP
Oasis Midstream Partners LP
Phillips 66 Partners LP
Shell Midstream Partners, L.P.
Valero Energy Partners LP
Antero Midstream Partners LP
04/17/18 Implied Implied
Unit Market Firm
Cap (1) Value (2)
Price
$18.25
$1,912
19.02
1,234
62.60
5,135
19.93 1,110
44.63
1,770
17.56
483
6,453
52.02
22.28 5,088
40.80
2,884
Low (6)
Median
High (6)
Current
Yield
$1,110
1,912
5,135
$1,894 5.9%
2,003 6.6%
6,300
1,062
2,537
874
DCF Yield (3)
2018E 2019E
7.6% 9.5%
10.0% 14.1%
6.5% 13.9% 19.1%
6.5%
8.2%
9.6%
11.2% 14.9%
8.5%
11.3% 17.1%
9,959 5.2% 10.8% 12.8%
5,844
4,117
6.0% 9.3% 14.2%
5.0% 11.7% 14.3%
$1,062
9.6%
5.0%
2,537 6.0%
6,300 6.6% 11.7% 17.1%
8.2%
10.8% 14.2%
$26.92 $5,032 $6,229 5.4% 11.6% 14.9%
Distribution CAGR (4)
2017A- 2018E-
2020E
2020E
11.4%
15.0%
16.3%
19.6%
19.9%
17.5%
13.2%
15.5%
17.1%
13.2%
16.3%
19.6%
27.9%
Source: Company Filings and Wall Street Research as of April 17, 2018.
(1) Implied Market Value of Equity equals common, subordinated and implied (or foxed) GP units, multiplied by the market price of common units.
(2) Implied Firm Value excludes the value of the general partner's IDRS.
(3) Defined as Distributable Cash Flow, per Wall Street consensus estimates, divided by Implied Market Cap.
(4) Wall Street consensus estimates.
(5) EBITDA less IDR distributions to sponsor.
(6) Excludes lowest and highest metrics to remove the impact of potential outlier effects from the analysis.
15.6%
15.1%
13.0%
14.6%
19.9%
17.4%
10.1%
11.8%
12.5%
11.8%
14.6%
17.4%
21.8%
2018E Dist.
Cash Flow (4) /
Current Dist.
13.0x
1.3x
1.4x 13.1x
NM
11.2x
1.3x
2.5x
10.9x
1.3x 13.8x
1.3x
11.2x
1.2x
12.4x
1.7x 11.3x
1.4x
Enterprise Value /
Adj. EBITDA (4)(5)
2018E 2019E
1.3x 11.2x
1.3x
11.8x
1.7x 13.1x
1.6x
Confidential
10.0x
9.3x
NM
9.2x
9.4x
8.9x
7.5x
8.7x
7.8x
9.1x
9.4x
7.5x
LTM
EBITDA
Margin
73%
71%
81%
71%
72%
65%
55%
52%
73%
55%
71%
73%
68%
BAIRD
Net Debt/
2018E
EBITDA (4)
NM
2.6x
1.4x
NM
1.6x
1.2x
2.6x
1.3x
2.9x
1.3x
1.6x
2.6x
1.7x
Project Bronco | Page 22View entire presentation