Disney Shareholder Engagement Presentation Deck
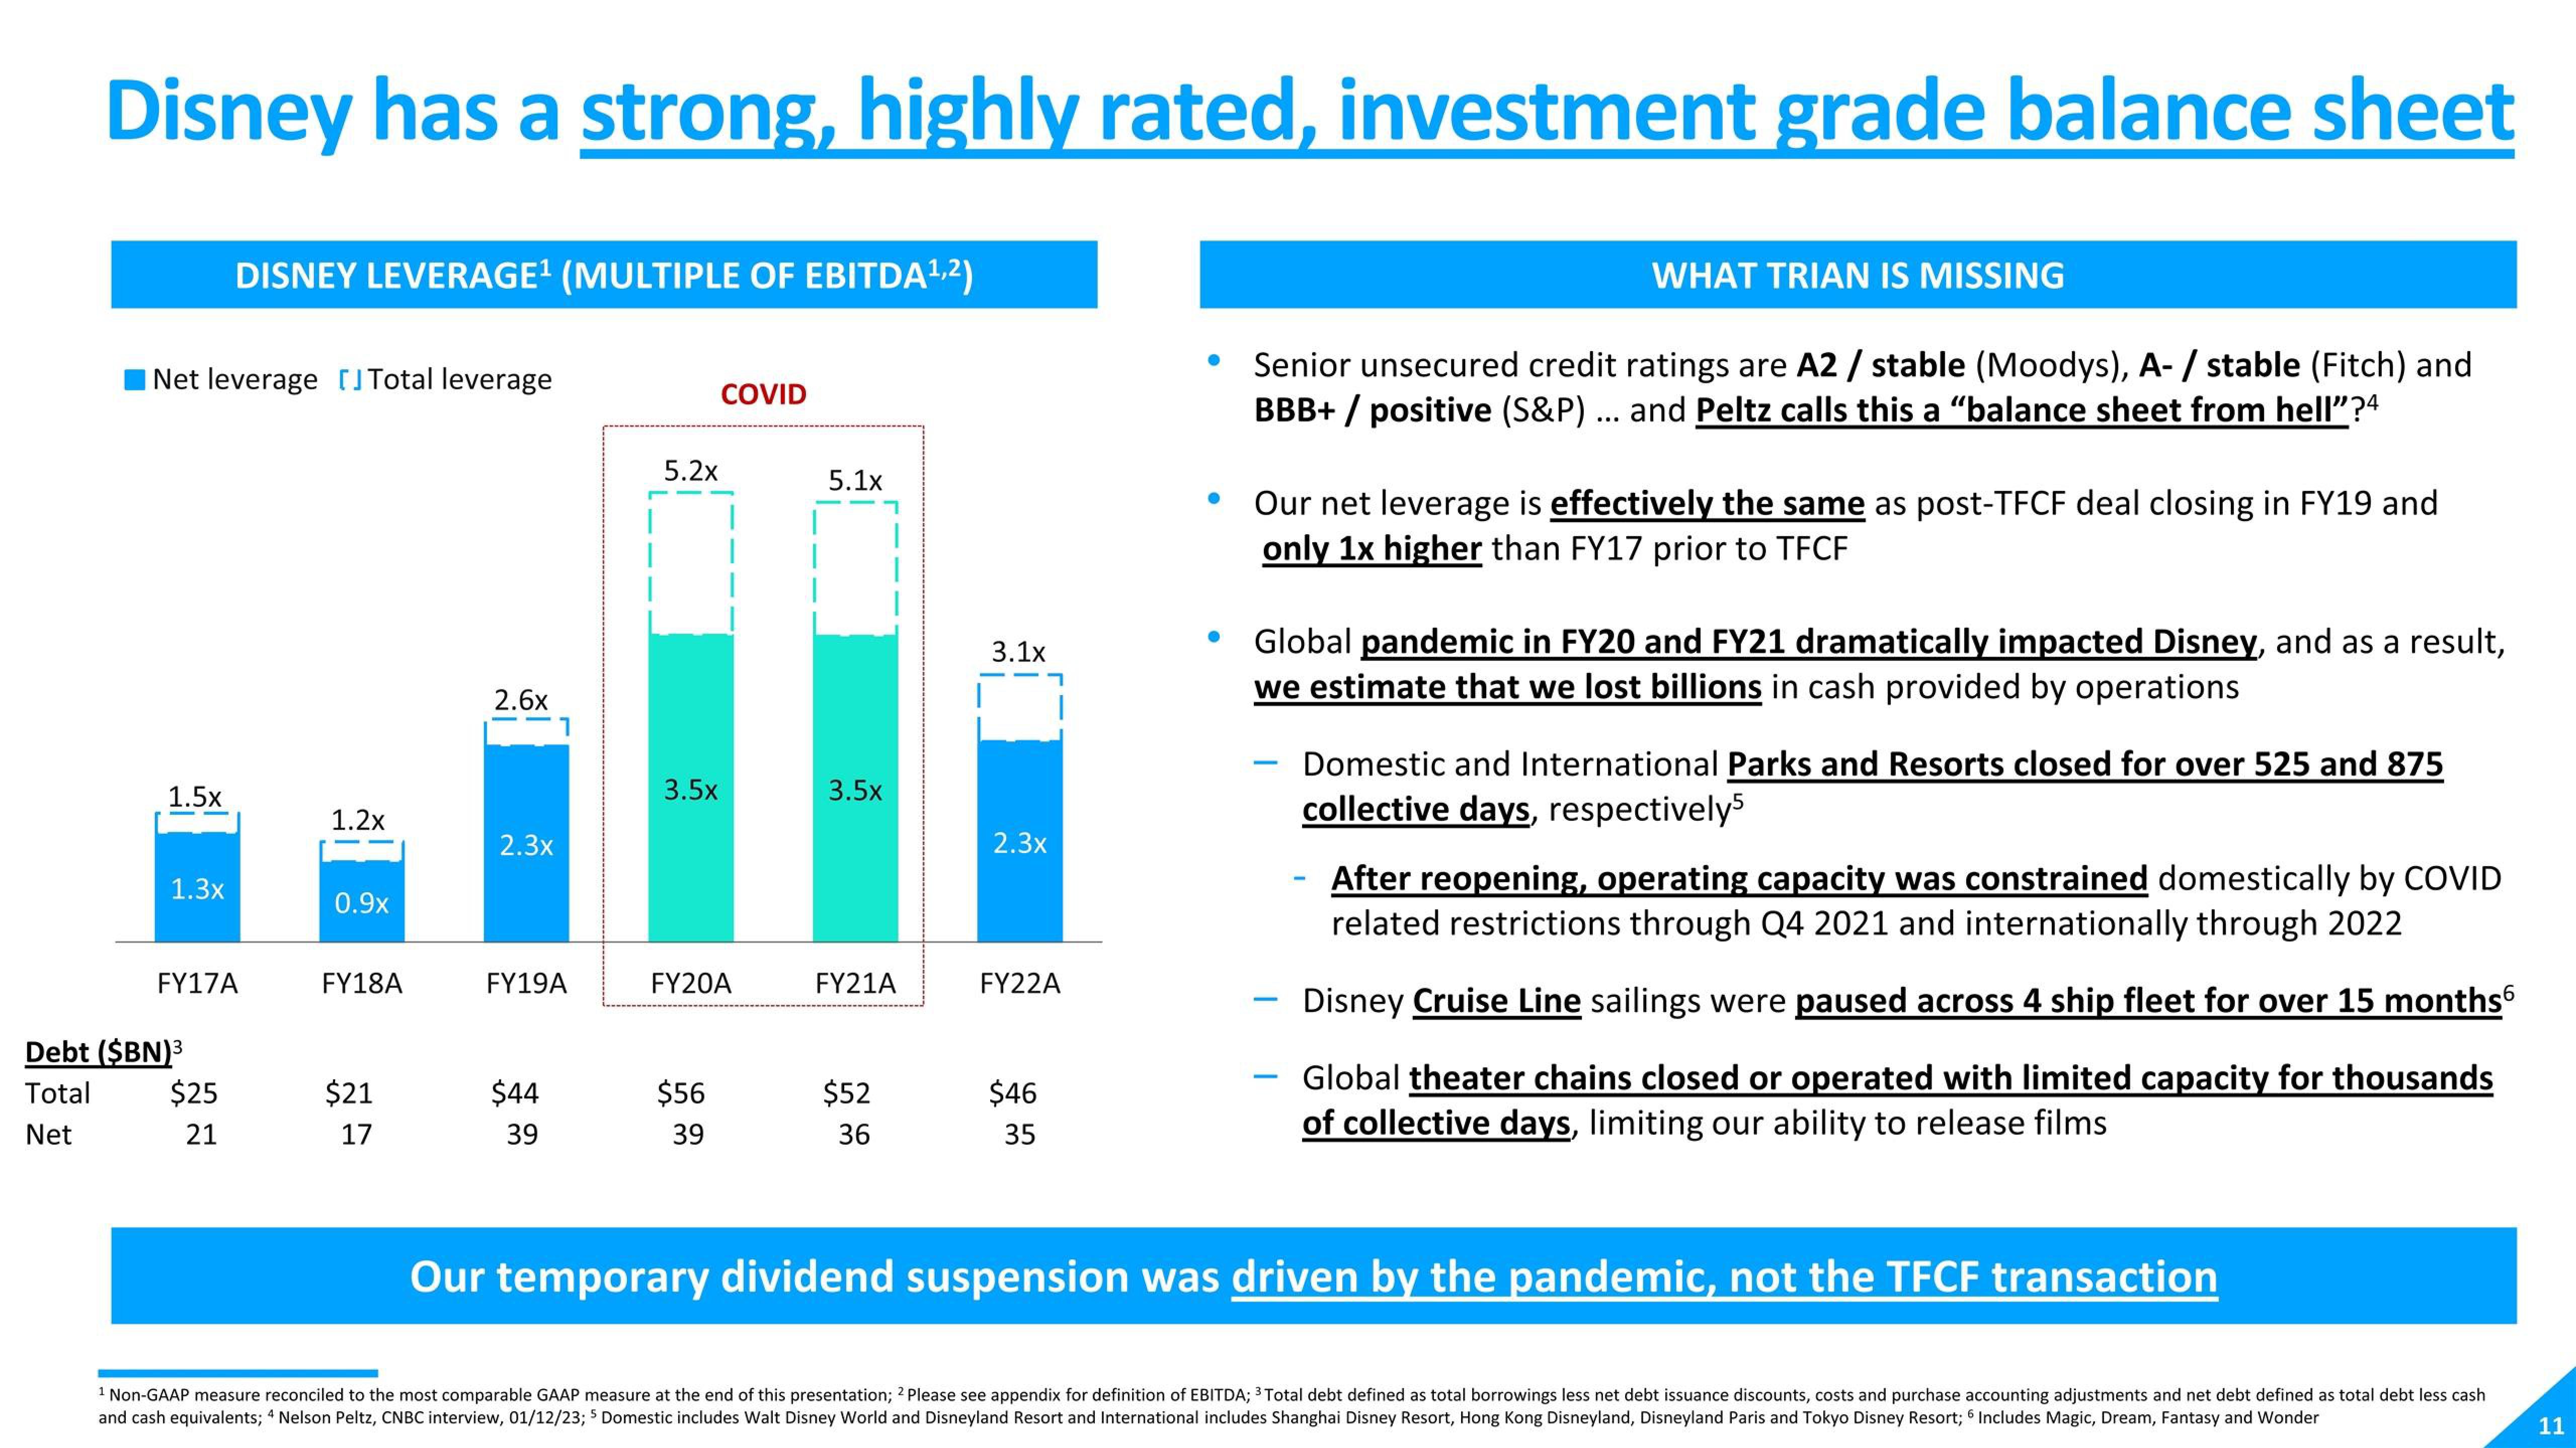
Disney has a strong, highly rated, investment grade balance sheet
Net leverage [] Total leverage
1.5x
1.3x
DISNEY LEVERAGE¹ (MULTIPLE OF EBITDA ¹,²)
FY17A
Debt ($BN)³
Total
Net
$25
21
1.2x
0.9x
FY18A
$21
17
2.6x
-1
2.3x
FY19A
$44
39
5.2x
3.5x
COVID
FY20A
$56
39
5.1x
3.5x
FY21A
$52
36
3.1x
2.3x
FY22A
$46
35
●
WHAT TRIAN IS MISSING
Senior unsecured credit ratings are A2 / stable (Moodys), A-/stable (Fitch) and
BBB+ / positive (S&P) ... and Peltz calls this a “balance sheet from hell"?4
Our net leverage is effectively the same as post-TFCF deal closing in FY19 and
only 1x higher than FY17 prior to TFCF
Global pandemic in FY20 and FY21 dramatically impacted Disney, and as a result,
we estimate that we lost billions in cash provided by operations
Domestic and International Parks and Resorts closed for over 525 and 875
collective days, respectively5
After reopening, operating capacity was constrained domestically by COVID
related restrictions through Q4 2021 and internationally through 2022
Disney Cruise Line sailings were paused across 4 ship fleet for over 15 months6
Global theater chains closed or operated with limited capacity for thousands
of collective days, limiting our ability to release films
Our temporary dividend suspension was driven by the pandemic, not the TFCF transaction
1 Non-GAAP measure reconciled to the most comparable GAAP measure at the end of this presentation; 2 Please see appendix for definition of EBITDA; ³ Total debt defined as total borrowings less net debt issuance discounts, costs and purchase accounting adjustments and net debt defined as total debt less cash
and cash equivalents; 4 Nelson Peltz, CNBC interview, 01/12/23; 5 Domestic includes Walt Disney World and Disneyland Resort and International includes Shanghai Disney Resort, Hong Kong Disneyland, Disneyland Paris and Tokyo Disney Resort; 6 Includes Magic, Dream, Fantasy and Wonder
11View entire presentation