Uber Results Presentation Deck
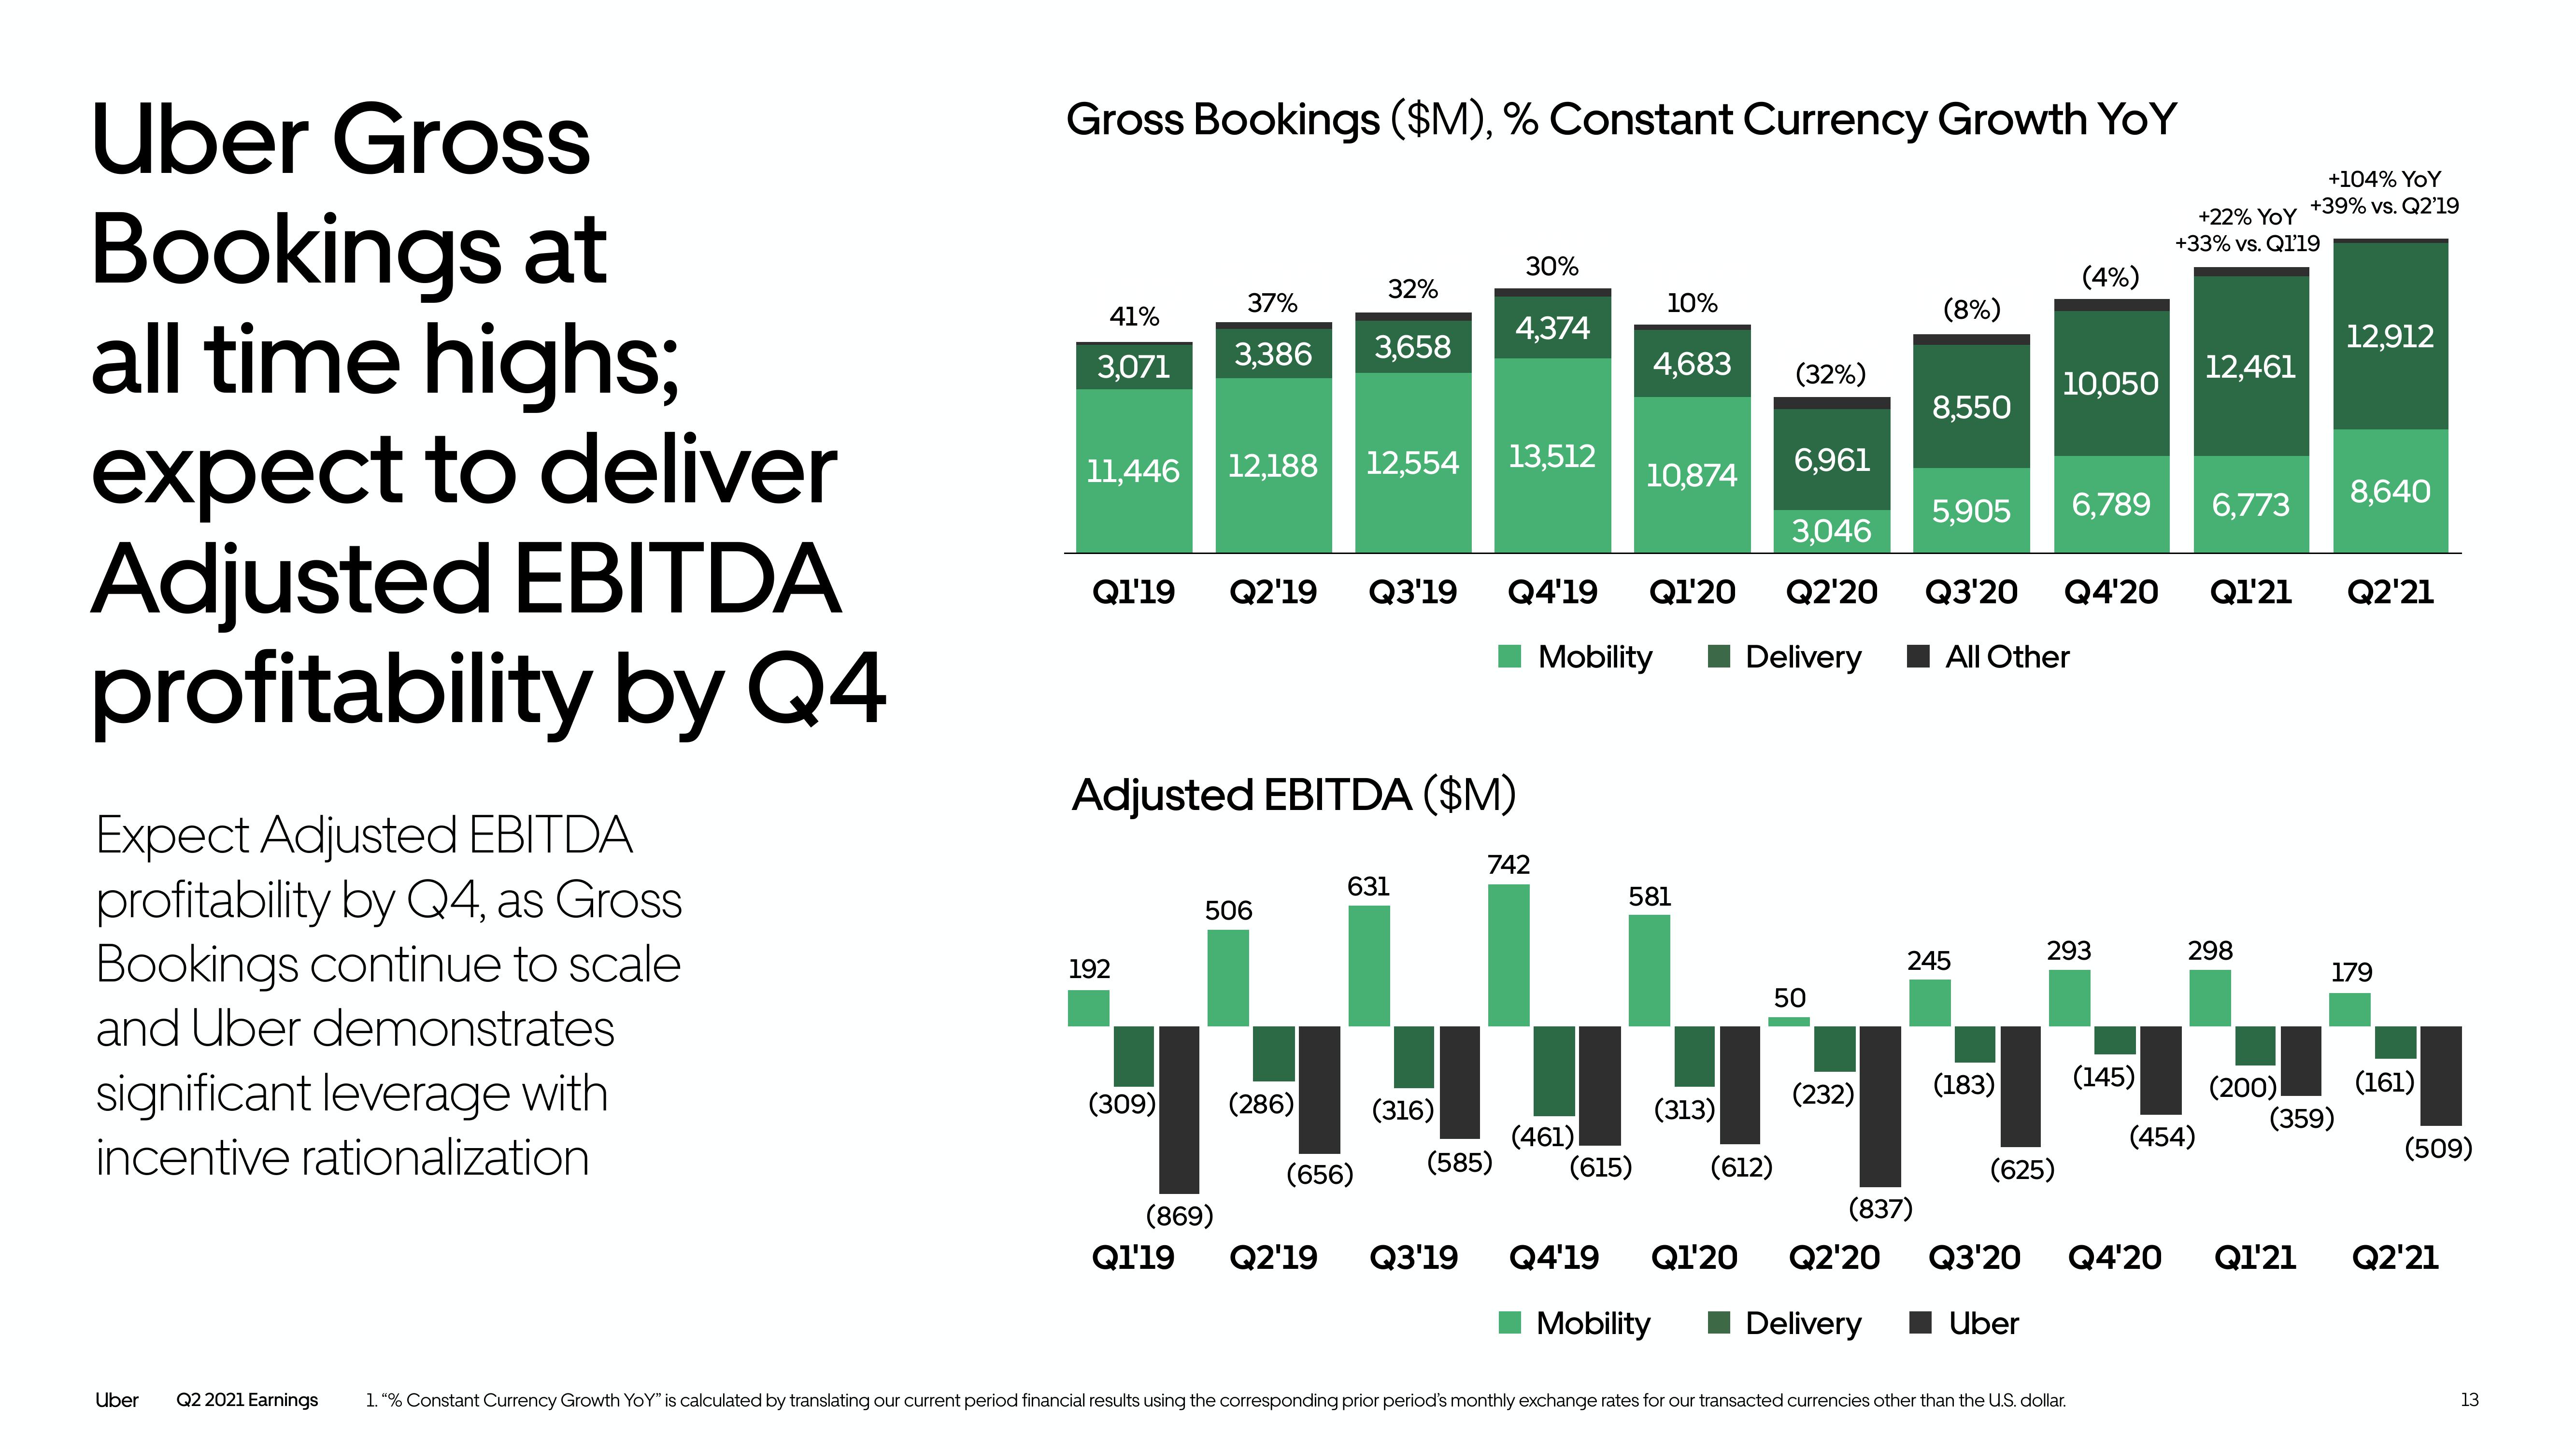
Uber Gross
Bookings at
all time highs;
expect to deliver
Adjusted EBITDA
profitability by Q4
Expect Adjusted EBITDA
profitability by Q4, as Gross
Bookings continue to scale
and Uber demonstrates
significant leverage with
incentive rationalization
Uber
Q2 2021 Earnings
Gross Bookings ($M), % Constant Currency Growth YoY
41%
3,071
37%
3,386
11,446 12,188 12,554
192
(309)
32%
3,658
Adjusted EBITDA ($M)
506
(869)
Q1'19
(286)
631
30%
4,374
(316)
13,512
6,961
5,905 6,789 6,773
3,046
Q1'19 Q2'19 Q3'19 Q4'19 Q1'20 Q2'20 Q3'20 Q4'20 Q1'21 Q2'21
Mobility
Delivery ■All Other
(656) (585)
742
10%
4,683 (32%)
(461)
10,874
(8%)
581
8,550
50
TUMA
(232)
(313)
(615)
(612)
245
(183)
(4%)
10,050
(625)
293
1. "% Constant Currency Growth YoY" is calculated by translating our current period financial results using the corresponding prior period's monthly exchange rates for our transacted currencies other than the U.S. dollar.
+22% YOY
+33% vs. Q1'19
(145)
12,461
298
(454)
+104% YoY
+39% vs. Q2'19
(200)
(837)
Q2'19 Q3'19 Q4'19 Q1'20 Q2'20 Q3'20 Q4'20 Q1'21
■ Mobility Delivery Uber
12,912
(359)
8,640
179
(161)
(509)
Q2'21
13View entire presentation