J.P.Morgan Results Presentation Deck
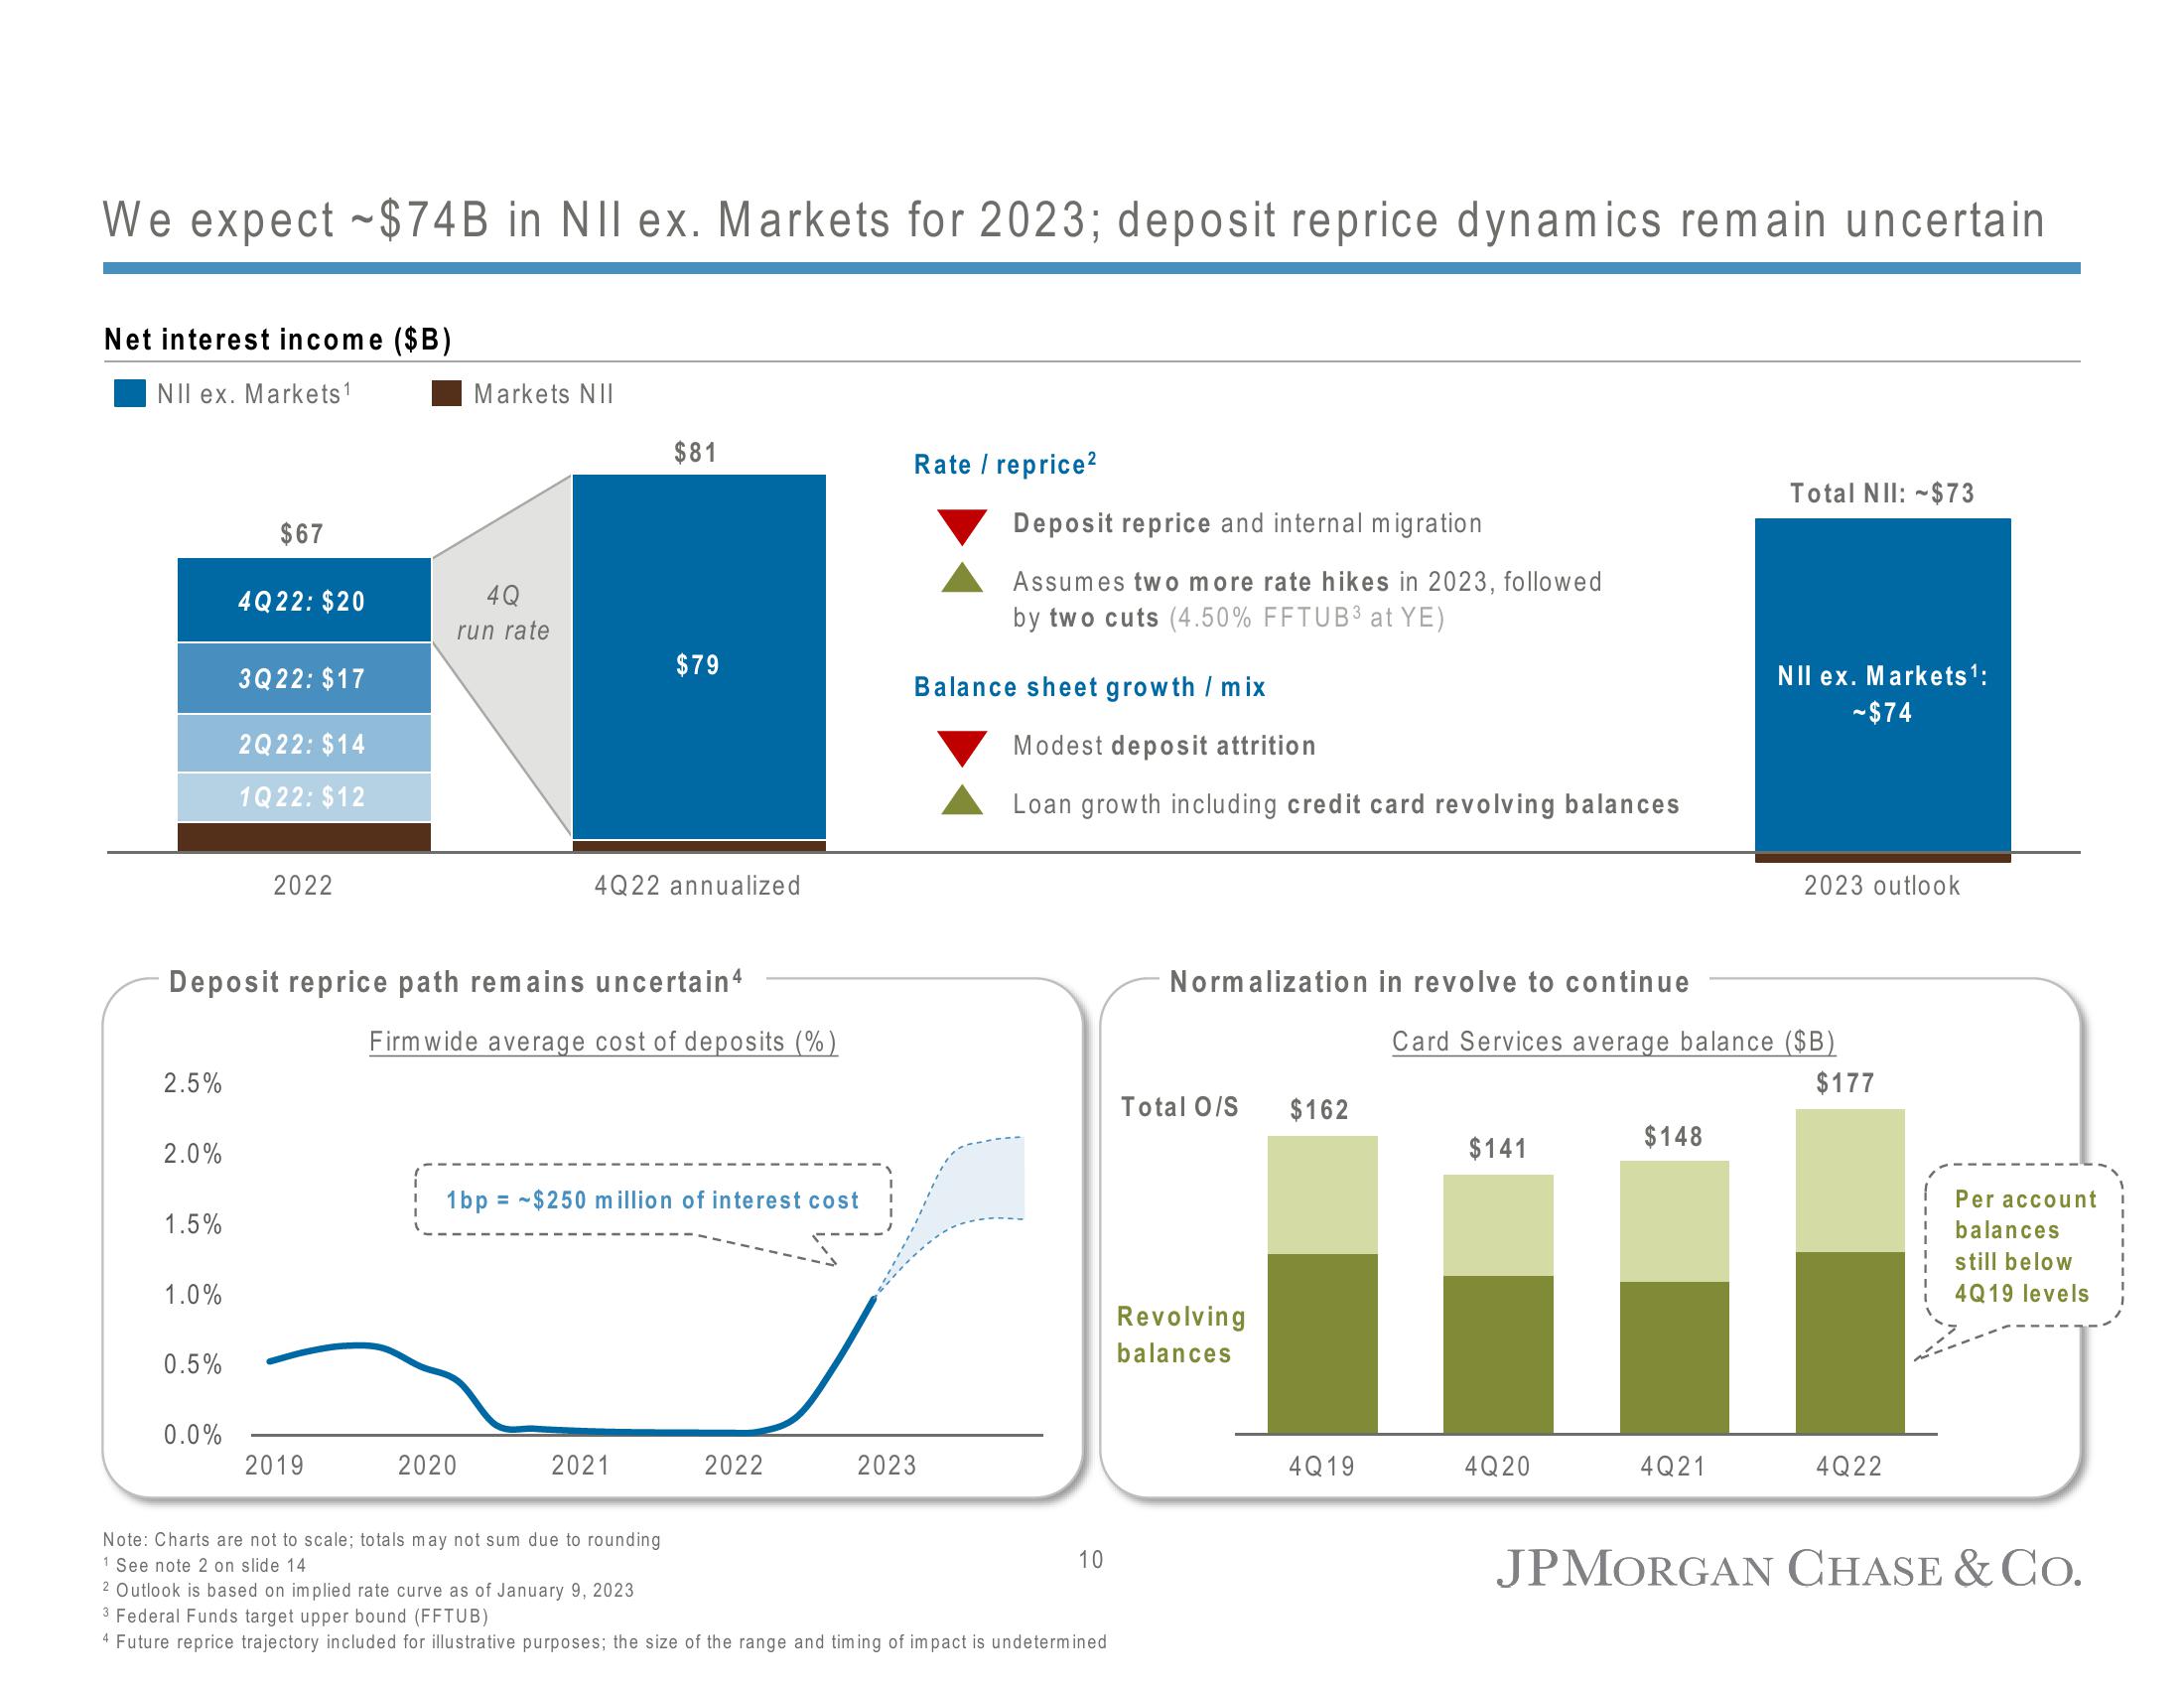
We expect -$74B in NII ex. Markets for 2023; deposit reprice dynamics remain uncertain
Net interest income ($B)
NII ex. Markets ¹
2.5%
2.0%
1.5%
1.0%
0.5%
$67
0.0%
4Q22: $20
3Q22: $17
2Q22: $14
1Q22: $12
2022
Deposit reprice path remains uncertain4
2019
Markets NII
4Q
run rate
$81
2020
$79
4Q22 annualized
Firm wide average cost of deposits (%)
1bp = $250 million of interest cost
2021
2022
Rate / reprice²
Deposit reprice and internal migration
Assumes two more rate hikes in 2023, followed
by two cuts (4.50% FFTUB3 at YE)
Balance sheet growth / mix
2023
Modest deposit attrition
Loan growth including credit card revolving balances
Note: Charts are not to scale; totals may not sum due to rounding
1 See note 2 on slide 14
2 Outlook is based on implied rate curve of January 9, 2023
3 Federal Funds target upper bound (FFTUB)
4 Future reprice trajectory included for illustrative purposes; the size of the range and timing of impact is undetermined
10
Normalization in revolve to continue
Total O/S
Revolving
balances
$162
4Q19
$141
4Q20
Card Services average balance ($B)
$177
$148
Total NII: $73
4Q21
NII ex. Markets ¹:
- $74
2023 outlook
4Q22
Per account
balances
still below
4Q19 levels
JPMORGAN CHASE & Co.View entire presentation