First Busey Results Presentation Deck
First Busey Corporation | Ticker: BUSE
Balanced, Low-Risk, Short Duration Investment Portfolio
Investment Portfolio Composition | 2023
2Q23 Earnings Investor Presentation
Municipals
8%
U.S. Treasuries
& Agencies
2%
Corporate
7%
CLOS
14%
CMOS
31%
Total Securities
(Amortized Cost):
$3.5
Billion
Commercial
MBS
17%
Residential
MBS
21%
All Mortgage-Backed Securities & Collateralized
Mortgage Obligations are Agency
■91% of Municipal holdings rated AA or better and
8% rated A
AFS % of
Amortized Cost
74%
HTM % of
Amortized Cost
26%
100% of Corporate holdings are investment grade
Collateralized Loan Obligation portfolio consists of
86% rated AAA and 14% rated AA
■
■
■
■
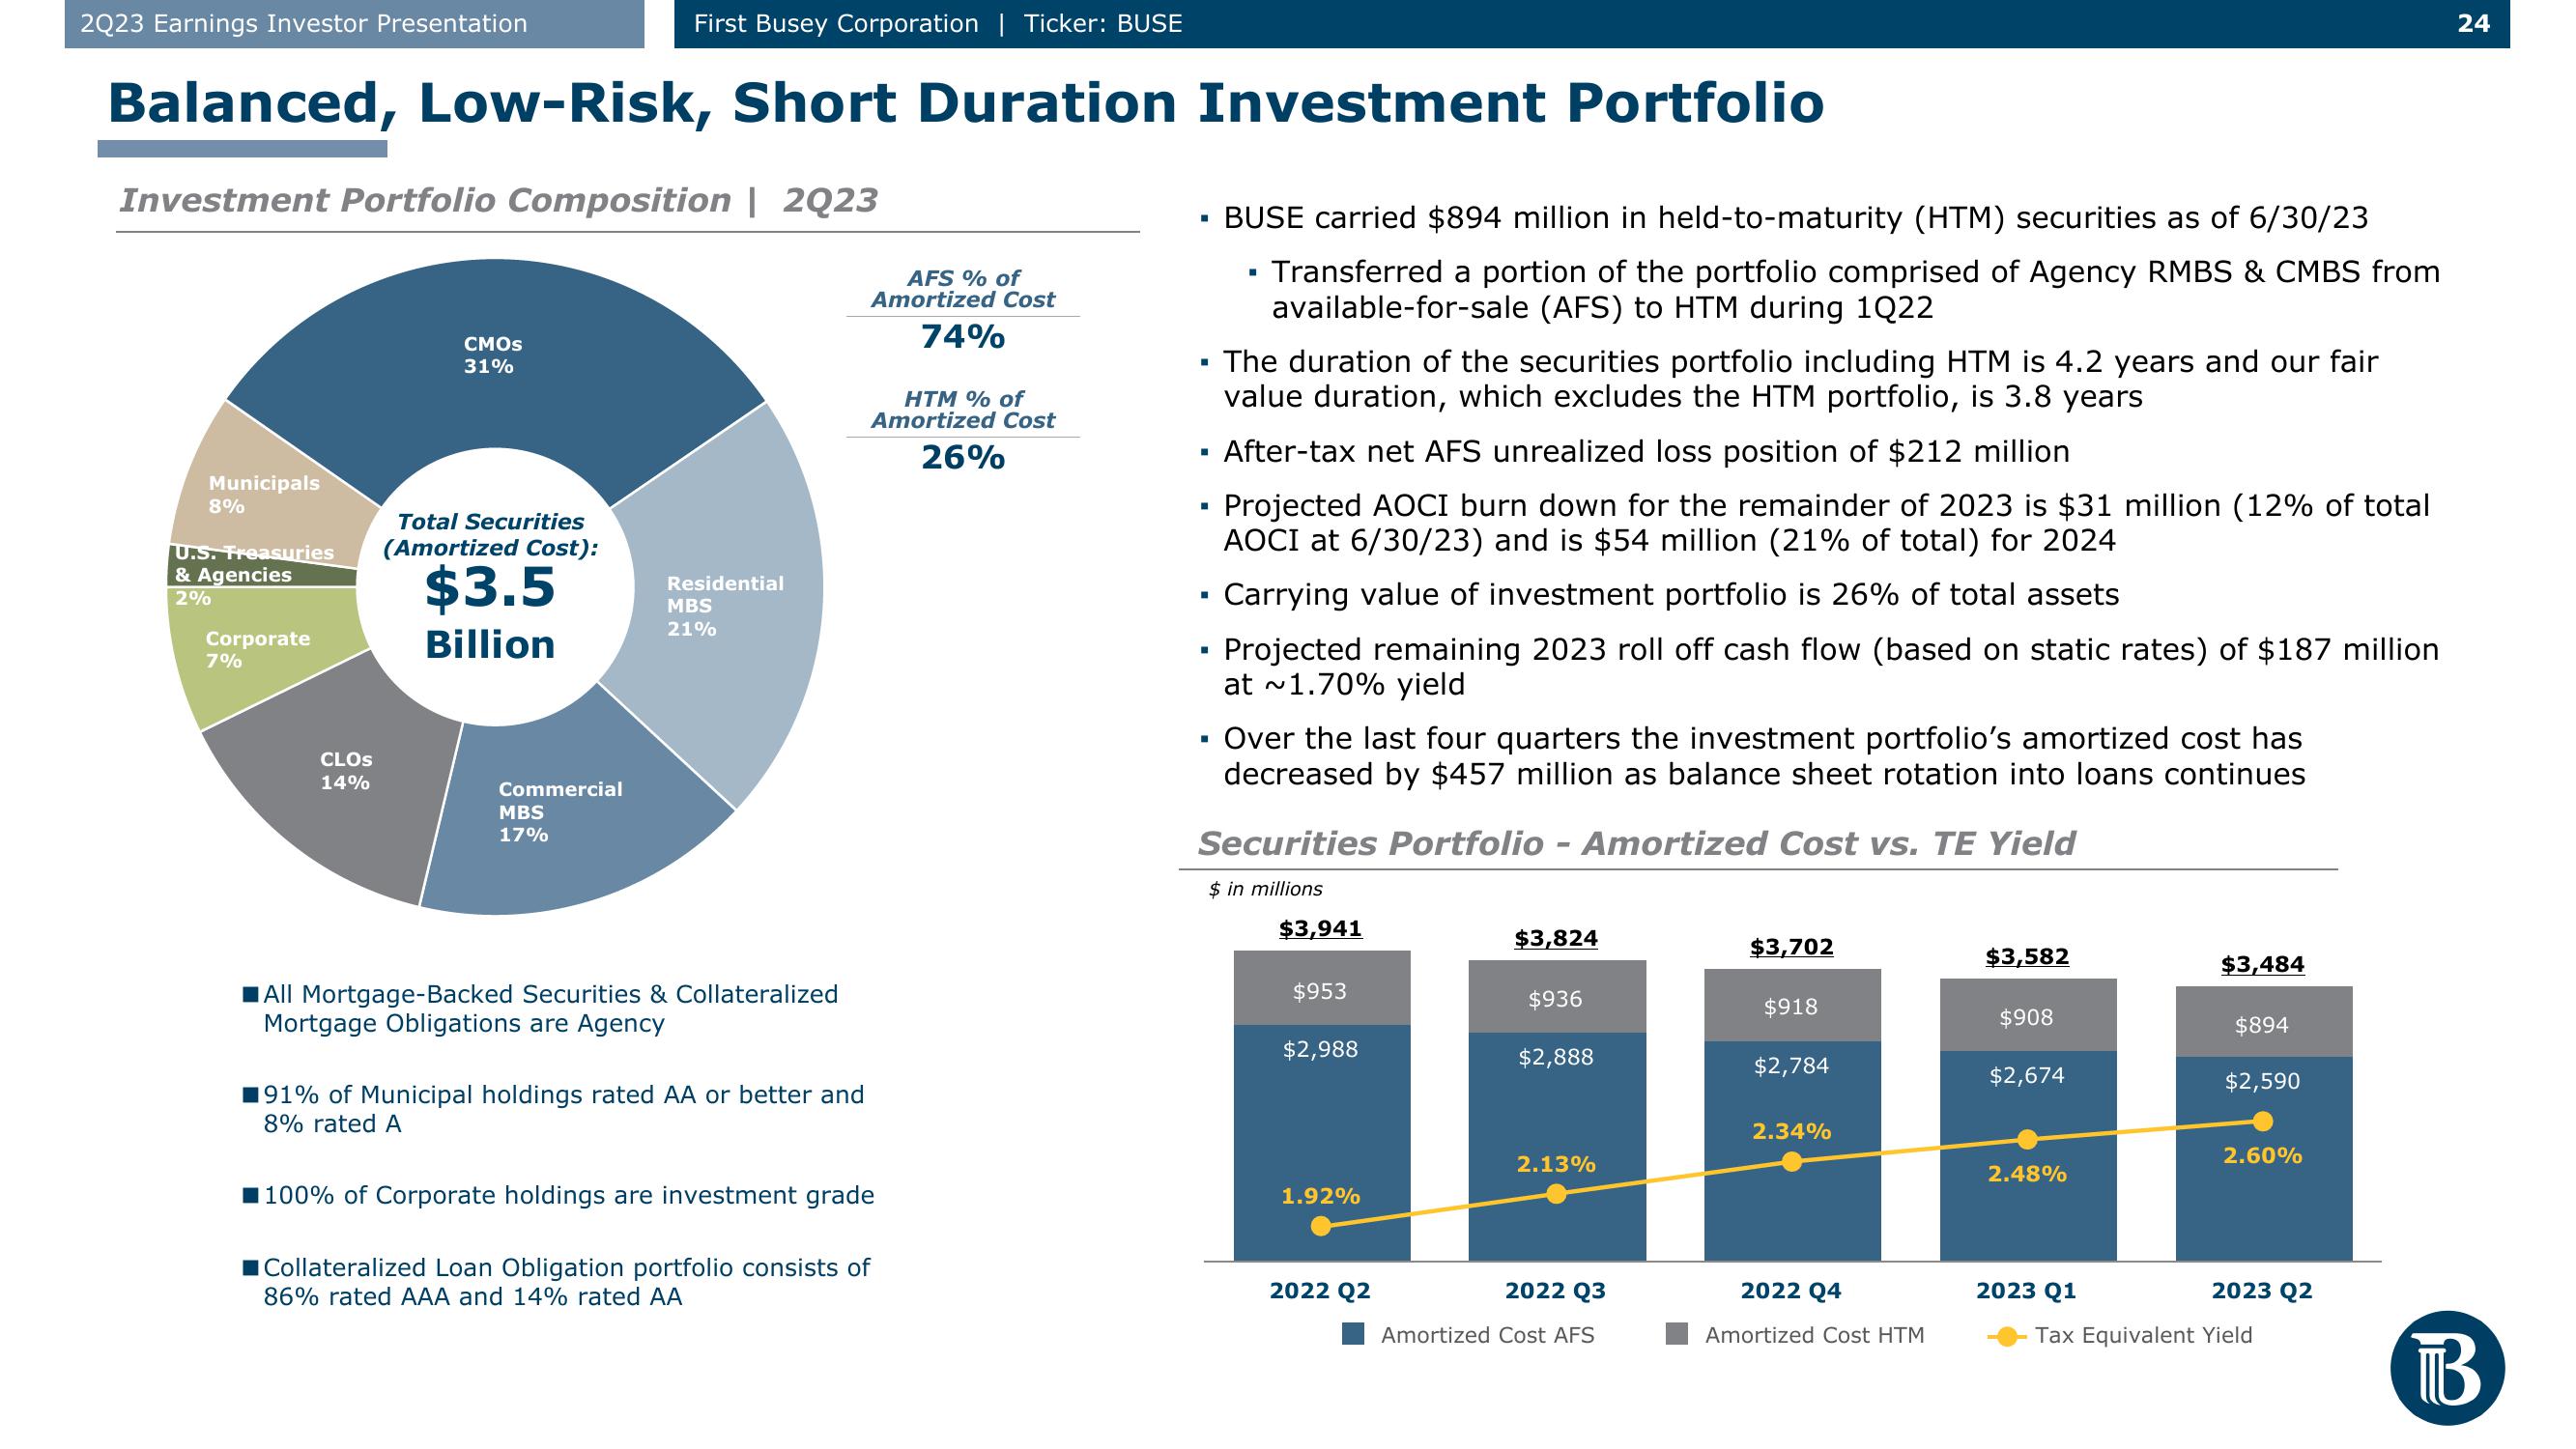
BUSE carried $894 million in held-to-maturity (HTM) securities as of 6/30/23
Transferred a portion of the portfolio comprised of Agency RMBS & CMBS from
available-for-sale (AFS) to HTM during 1Q22
■
The duration of the securities portfolio including HTM is 4.2 years and our fair
value duration, which excludes the HTM portfolio, is 3.8 years
After-tax net AFS unrealized loss position of $212 million
Projected AOCI burn down for the remainder of 2023 is $31 million (12% of total
AOCI at 6/30/23) and is $54 million (21% of total) for 2024
Carrying value of investment portfolio is 26% of total assets
Projected remaining 2023 roll off cash flow (based on static rates) of $187 million
at ~1.70% yield
Over the last four quarters the investment portfolio's amortized cost has
decreased by $457 million as balance sheet rotation into loans continues
Securities Portfolio - Amortized Cost vs. TE Yield
$ in millions
$3,941
$953
$2,988
1.92%
2022 Q2
$3,824
$936
$2,888
2.13%
2022 Q3
Amortized Cost AFS
$3,702
$918
$2,784
2.34%
2022 Q4
Amortized Cost HTM
$3,582
$908
$2,674
2.48%
2023 Q1
$3,484
$894
$2,590
2.60%
2023 Q2
Tax Equivalent Yield
24
BView entire presentation