J.P.Morgan Results Presentation Deck
2Q23 Financial highlights
ROTCE¹
25%
Income statement
Balance sheet
Capital distributed
CET1 capital ratios²
Std. 13.8% | Adv. 13.9%
Total Loss-Absorbing Capacity² $494B
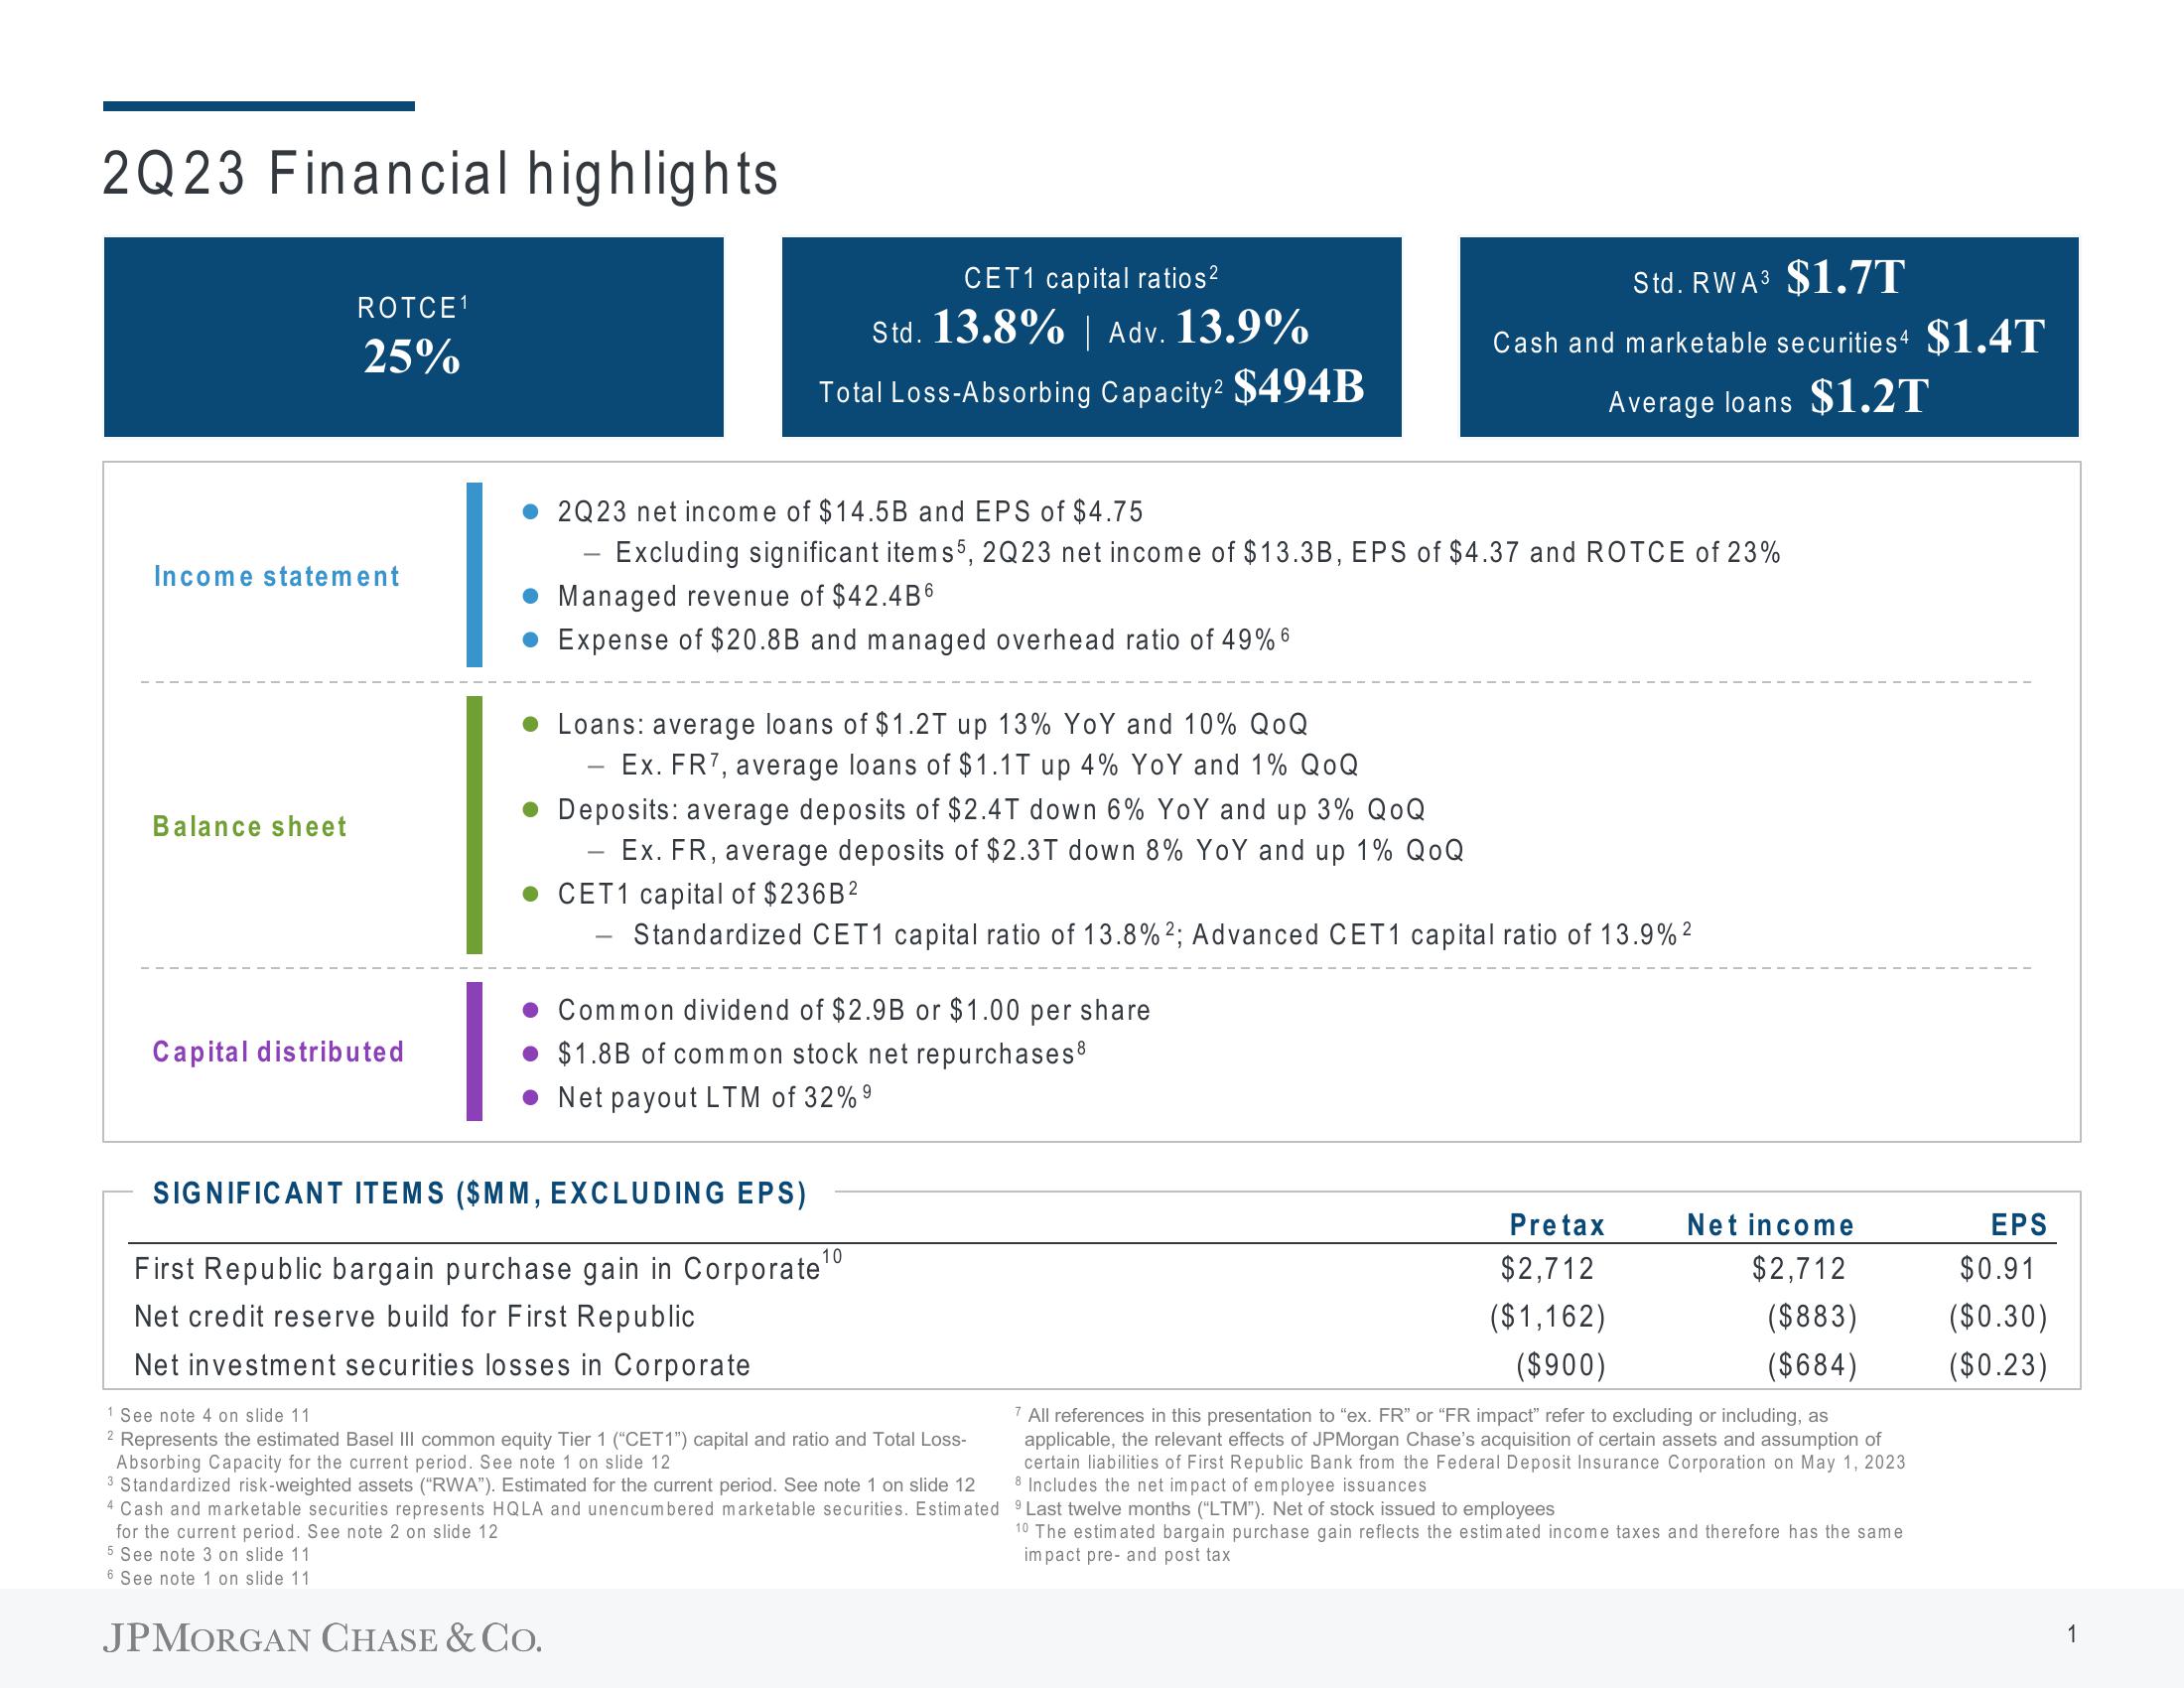
2Q23 net income of $14.5B and EPS of $4.75
Excluding significant items 5, 2Q23 net income of $13.3B, EPS of $4.37 and ROTCE of 23%
• Managed revenue of $42.4B6
Expense of $20.8B and managed overhead ratio of 49% 6
Loans: average loans of $1.2T up 13% YoY and 10% QOQ
Ex. FR7, average loans of $1.1T up 4% YoY and 1% QOQ
• Deposits: average deposits of $2.4T down 6% YoY and up 3% QoQ
Ex. FR, average deposits of $2.3T down 8% YoY and up 1% QOQ
CET1 capital of $236B²
Standardized CET1 capital ratio of 13.8% 2; Advanced CET1 capital ratio of 13.9% ²
-
• Common dividend of $2.9B or $1.00 per share
$1.8B of common stock net repurchases8
Net payout LTM of 32% 9
SIGNIFICANT ITEMS ($MM, EXCLUDING EPS)
10
First Republic bargain purchase gain in Corporate ¹0
Net credit reserve build for First Republic
Net investment securities losses in Corporate
JPMORGAN CHASE & CO.
Std. RWA3 $1.7T
Cash and marketable securities4 $1.4T
Average loans $1.2T
1 See note 4 on slide 11
2 Represents the estimated Basel III common equity Tier 1 ("CET1") capital and ratio and Total Loss-
Absorbing Capacity for the current period. See note 1 on slide 12
3 Standardized risk-weighted assets ("RWA"). Estimated for the current period. See note 1 on slide 12
4 Cash and marketable securities represents HQLA and unencumbered marketable securities. Estimated
for the current period. See note 2 on slide 12
5 See note 3 on slide 11.
6 See note 1 on slide 11.
Pretax
$2,712
($1,162)
($900)
Net income
$2,712
($883)
($684)
7 All references in this presentation to "ex. FR" or "FR impact" refer to excluding or including, as
applicable, the relevant effects of JPMorgan Chase's acquisition of certain assets and assumption of
certain liabilities of First Republic Bank from the Federal Deposit Insurance Corporation on May 1, 2023
8 Includes the net impact of employee issuances
Last twelve months ("LTM"). Net of stock issued to employees
10 The estimated bargain purchase gain reflects the estimated income taxes and therefore has the same
impact pre- and post tax
EPS
$0.91
($0.30)
($0.23)
1View entire presentation