Bausch+Lomb Results Presentation Deck
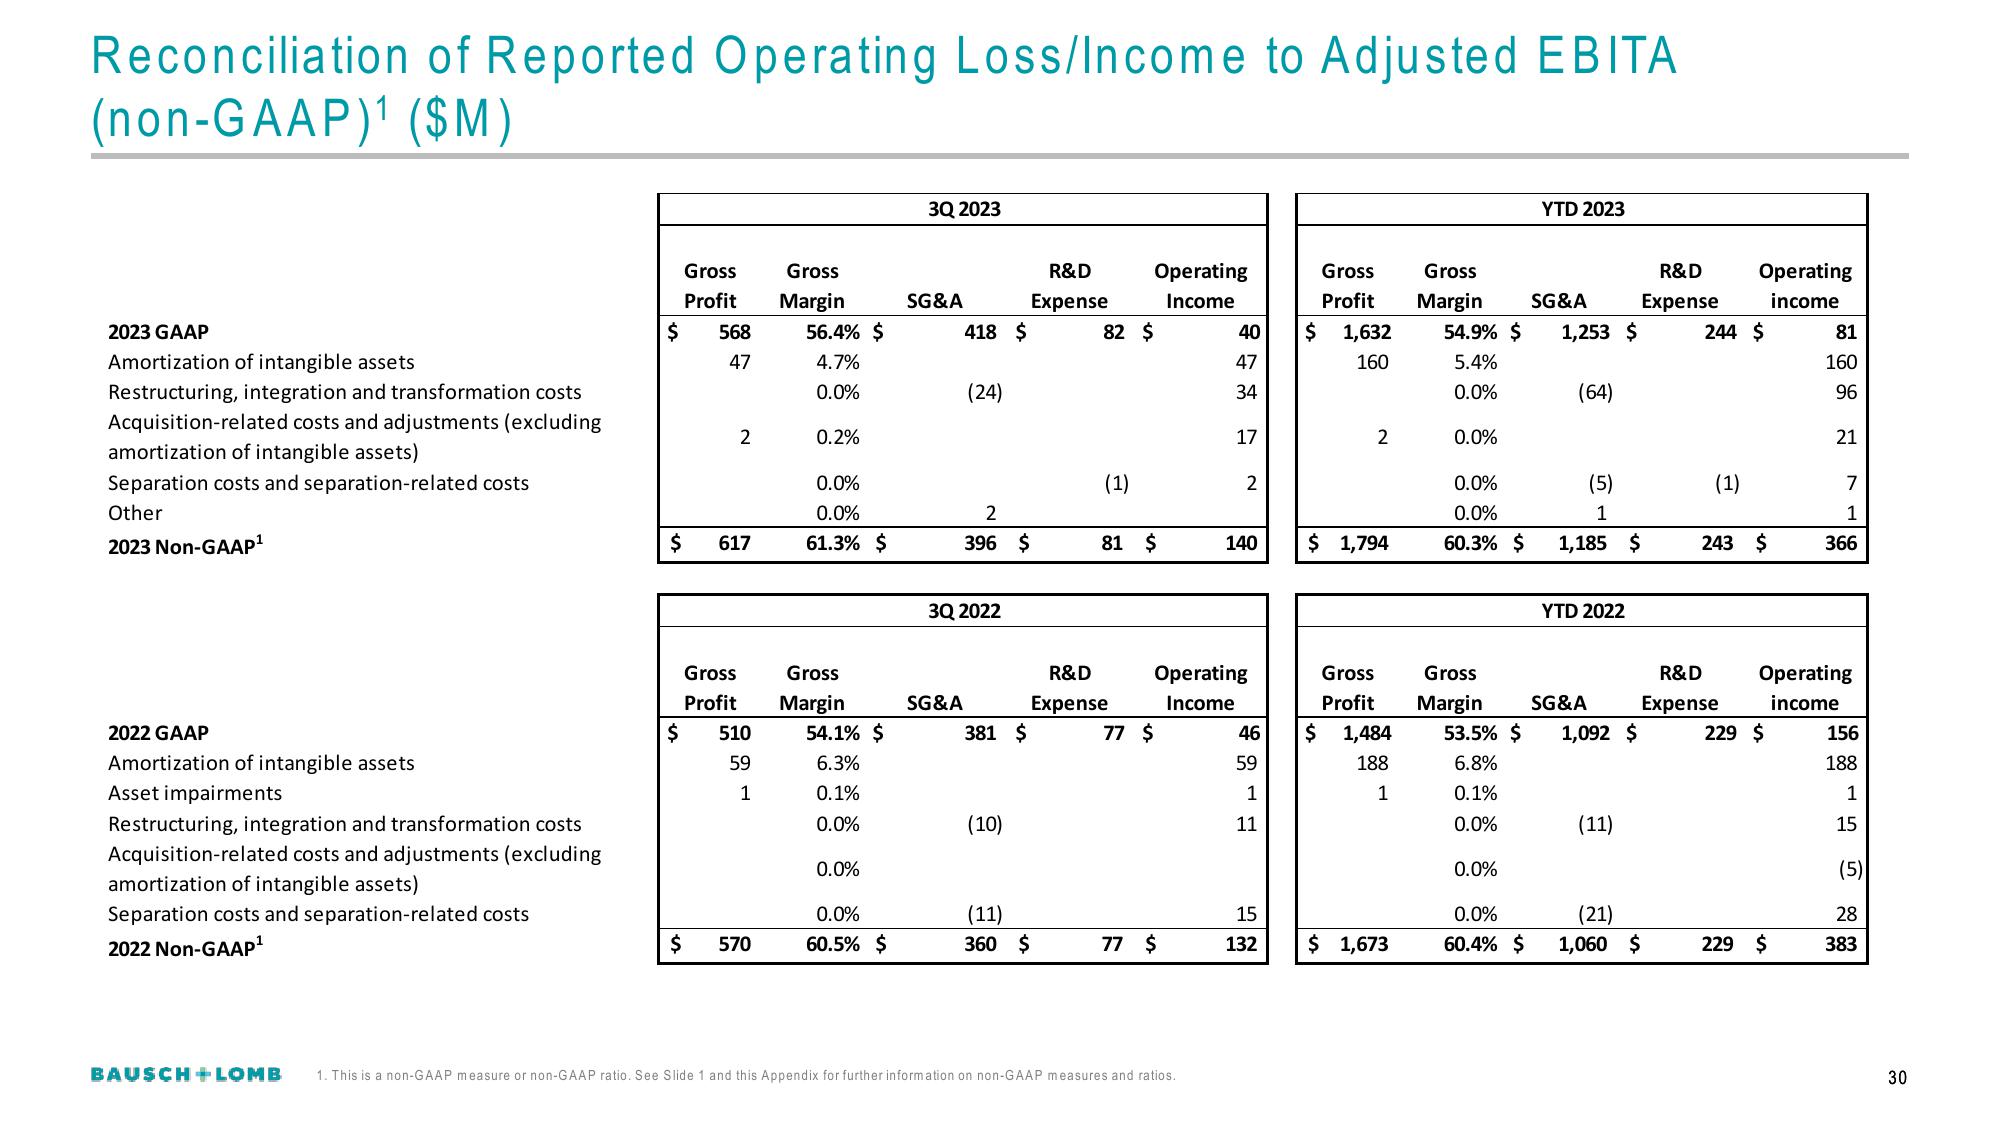
Reconciliation of Reported Operating Loss/Income to Adjusted EBITA
(non-GAAP)¹ ($M)
2023 GAAP
Amortization of intangible assets
Restructuring, integration and transformation costs
Acquisition-related costs and adjustments (excluding
amortization of intangible assets)
Separation costs and separation-related costs
Other
2023 Non-GAAP¹
2022 GAAP
Amortization of intangible assets
Asset impairments
Restructuring, integration and transformation costs
Acquisition-related costs and adjustments (excluding
amortization of intangible assets)
Separation costs and separation-related costs
2022 Non-GAAP¹
$
Gross
Profit
568
47
$
$ 617
2
Gross
Profit
510
59
1
$ 570
Gross
Margin
56.4% $
4.7%
0.0%
0.2%
0.0%
0.0%
61.3% $
Gross
Margin
54.1% $
6.3%
0.1%
0.0%
0.0%
0.0%
60.5% $
3Q 2023
SG&A
418 $
(24)
2
396 $
3Q 2022
SG&A
381 $
(10)
(11)
360 $
R&D
Expense
82 $
(1)
Operating
Income
81 $
R&D
Expense
77 $
77 $
40
47
34
17
Operating
Income
BAUSCH+ LOMB 1. This is a non-GAAP measure or non-GAAP ratio. See Slide 1 and this Appendix for further information on non-GAAP measures and ratios.
2
140
15
132
Gross Gross
R&D
Profit Margin SG&A Expense
54.9% $ 1,253 $
5.4%
0.0%
$ 1,632
160
2
$ 1,794
Gross
Profit
46 $ 1,484
59
188
1
1
11
$ 1,673
0.0%
0.0%
0.0%
60.3% $
Gross
Margin
53.5% $
6.8%
0.1%
0.0%
0.0%
YTD 2023
0.0%
60.4% $
(64)
(5)
1
1,185 $
YTD 2022
SG&A
1,092 $
(11)
(21)
1,060 $
244 $
(1)
Operating
income
243 $
R&D
Expense
229
229 $
81
160
96
$
21
Operating
income
7
1
366
156
188
1
15
(5)
28
383
30View entire presentation