IBEX Results Presentation Deck
ibex.
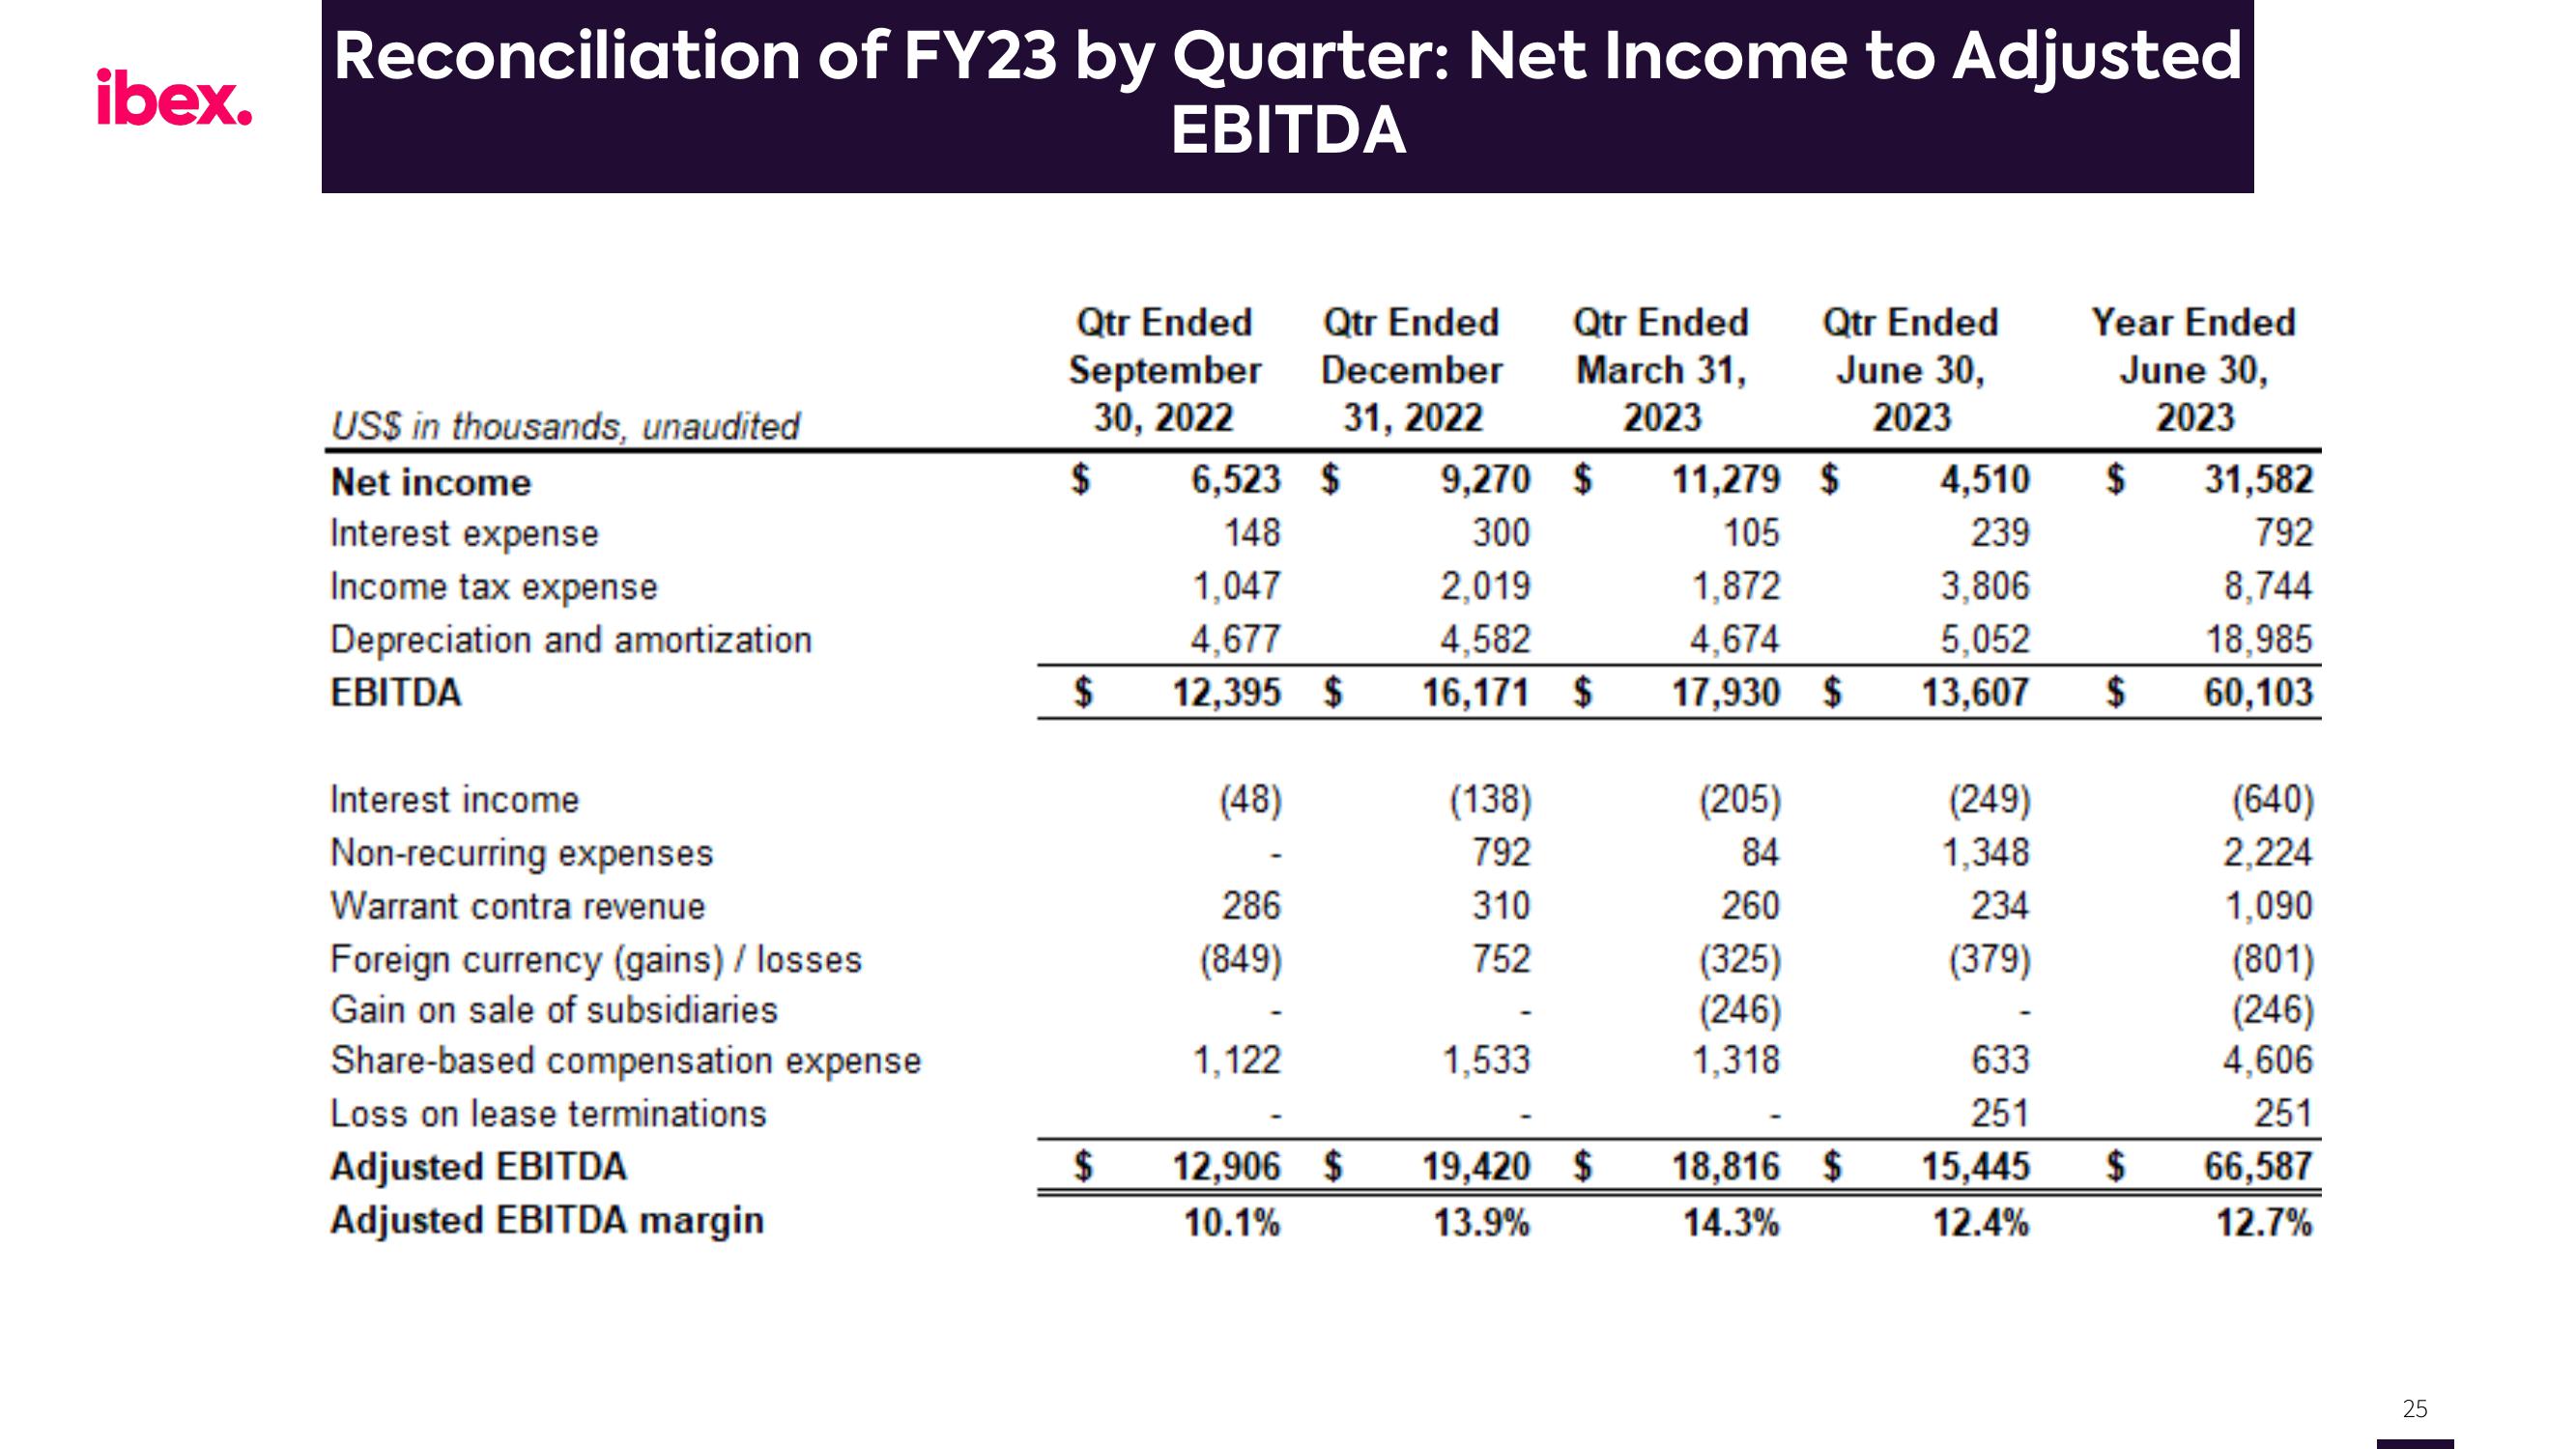
Reconciliation of FY23 by Quarter: Net Income to Adjusted
EBITDA
US$ in thousands, unaudited
Net income
Interest expense
Income tax expense
Depreciation and amortization
EBITDA
Interest income
Non-recurring expenses
Warrant contra revenue
Foreign currency (gains) / losses
Gain on sale of subsidiaries
Share-based compensation expense
Loss on lease terminations
Adjusted EBITDA
Adjusted EBITDA margin
Qtr Ended Qtr Ended
September
30, 2022
December
31, 2022
9,270
$
300
$
LA
$
6,523 $
148
1.047
4,677
12,395 $
(48)
286
(849)
1,122
12,906 $
10.1%
(138)
792
310
752
Qtr Ended
March 31,
2023
$ 11,279 $
105
2,019
1,872
4,582
4,674
16,171 $ 17,930 $
1,533
19,420 $
13.9%
Qtr Ended
June 30,
2023
(205)
84
260
(325)
(246)
1,318
18,816 $
14.3%
4,510
239
3.806
5,052
13,607
(249)
1,348
234
(379)
633
251
15,445
12.4%
Year Ended
June 30,
2023
$ 31,582
792
8,744
18,985
$ 60,103
$
(640)
2,224
1,090
(801)
(246)
4,606
251
66,587
12.7%
25View entire presentation