Better SPAC Presentation Deck
Homeownership
market is
enormous...
●
●
●
Annual spend within the housing
market accounted for over $3 trillion,
~15% of US GDP in 2019
6 million homes purchased annually
in the US, 87% through a mortgage
Mortgages make up 70% of
consumer credit in the US
For average households, home equity
totals ~65% of net worth
100% mortgage transactions require
at least one insurance product
1. '21-'25 Projected average annual US origination volume (FNMA '21-22
forecast, 2.5% YOY growth '23-25); 2. Global average annual origination
volume excluding US (Better research, various public sources); 3. $1.7tr of
home rental, $763bn of home improvement $8bn of US appraisal and
inspection, $80bn of moving and storage and $1.4tr of iBuying; 4.
$880bn auto insurance, $764bn of home and personal liability
insurance, $1.7tr life insurance market and $1.6tn of student loan and
credit card debt. Note: Refer to page 30 for additional sourcing
information.
Data Sources: Congressional Research Service, Freddie Mac, Company
websites, Edmunds, FactSet, McKinsey Global Research, Mortgage
Bankers Association and PwC. US Census Bureau. RealtyTrac, CFPB,
FRED, NAHB. Public company research and other publicly available
information.
Better
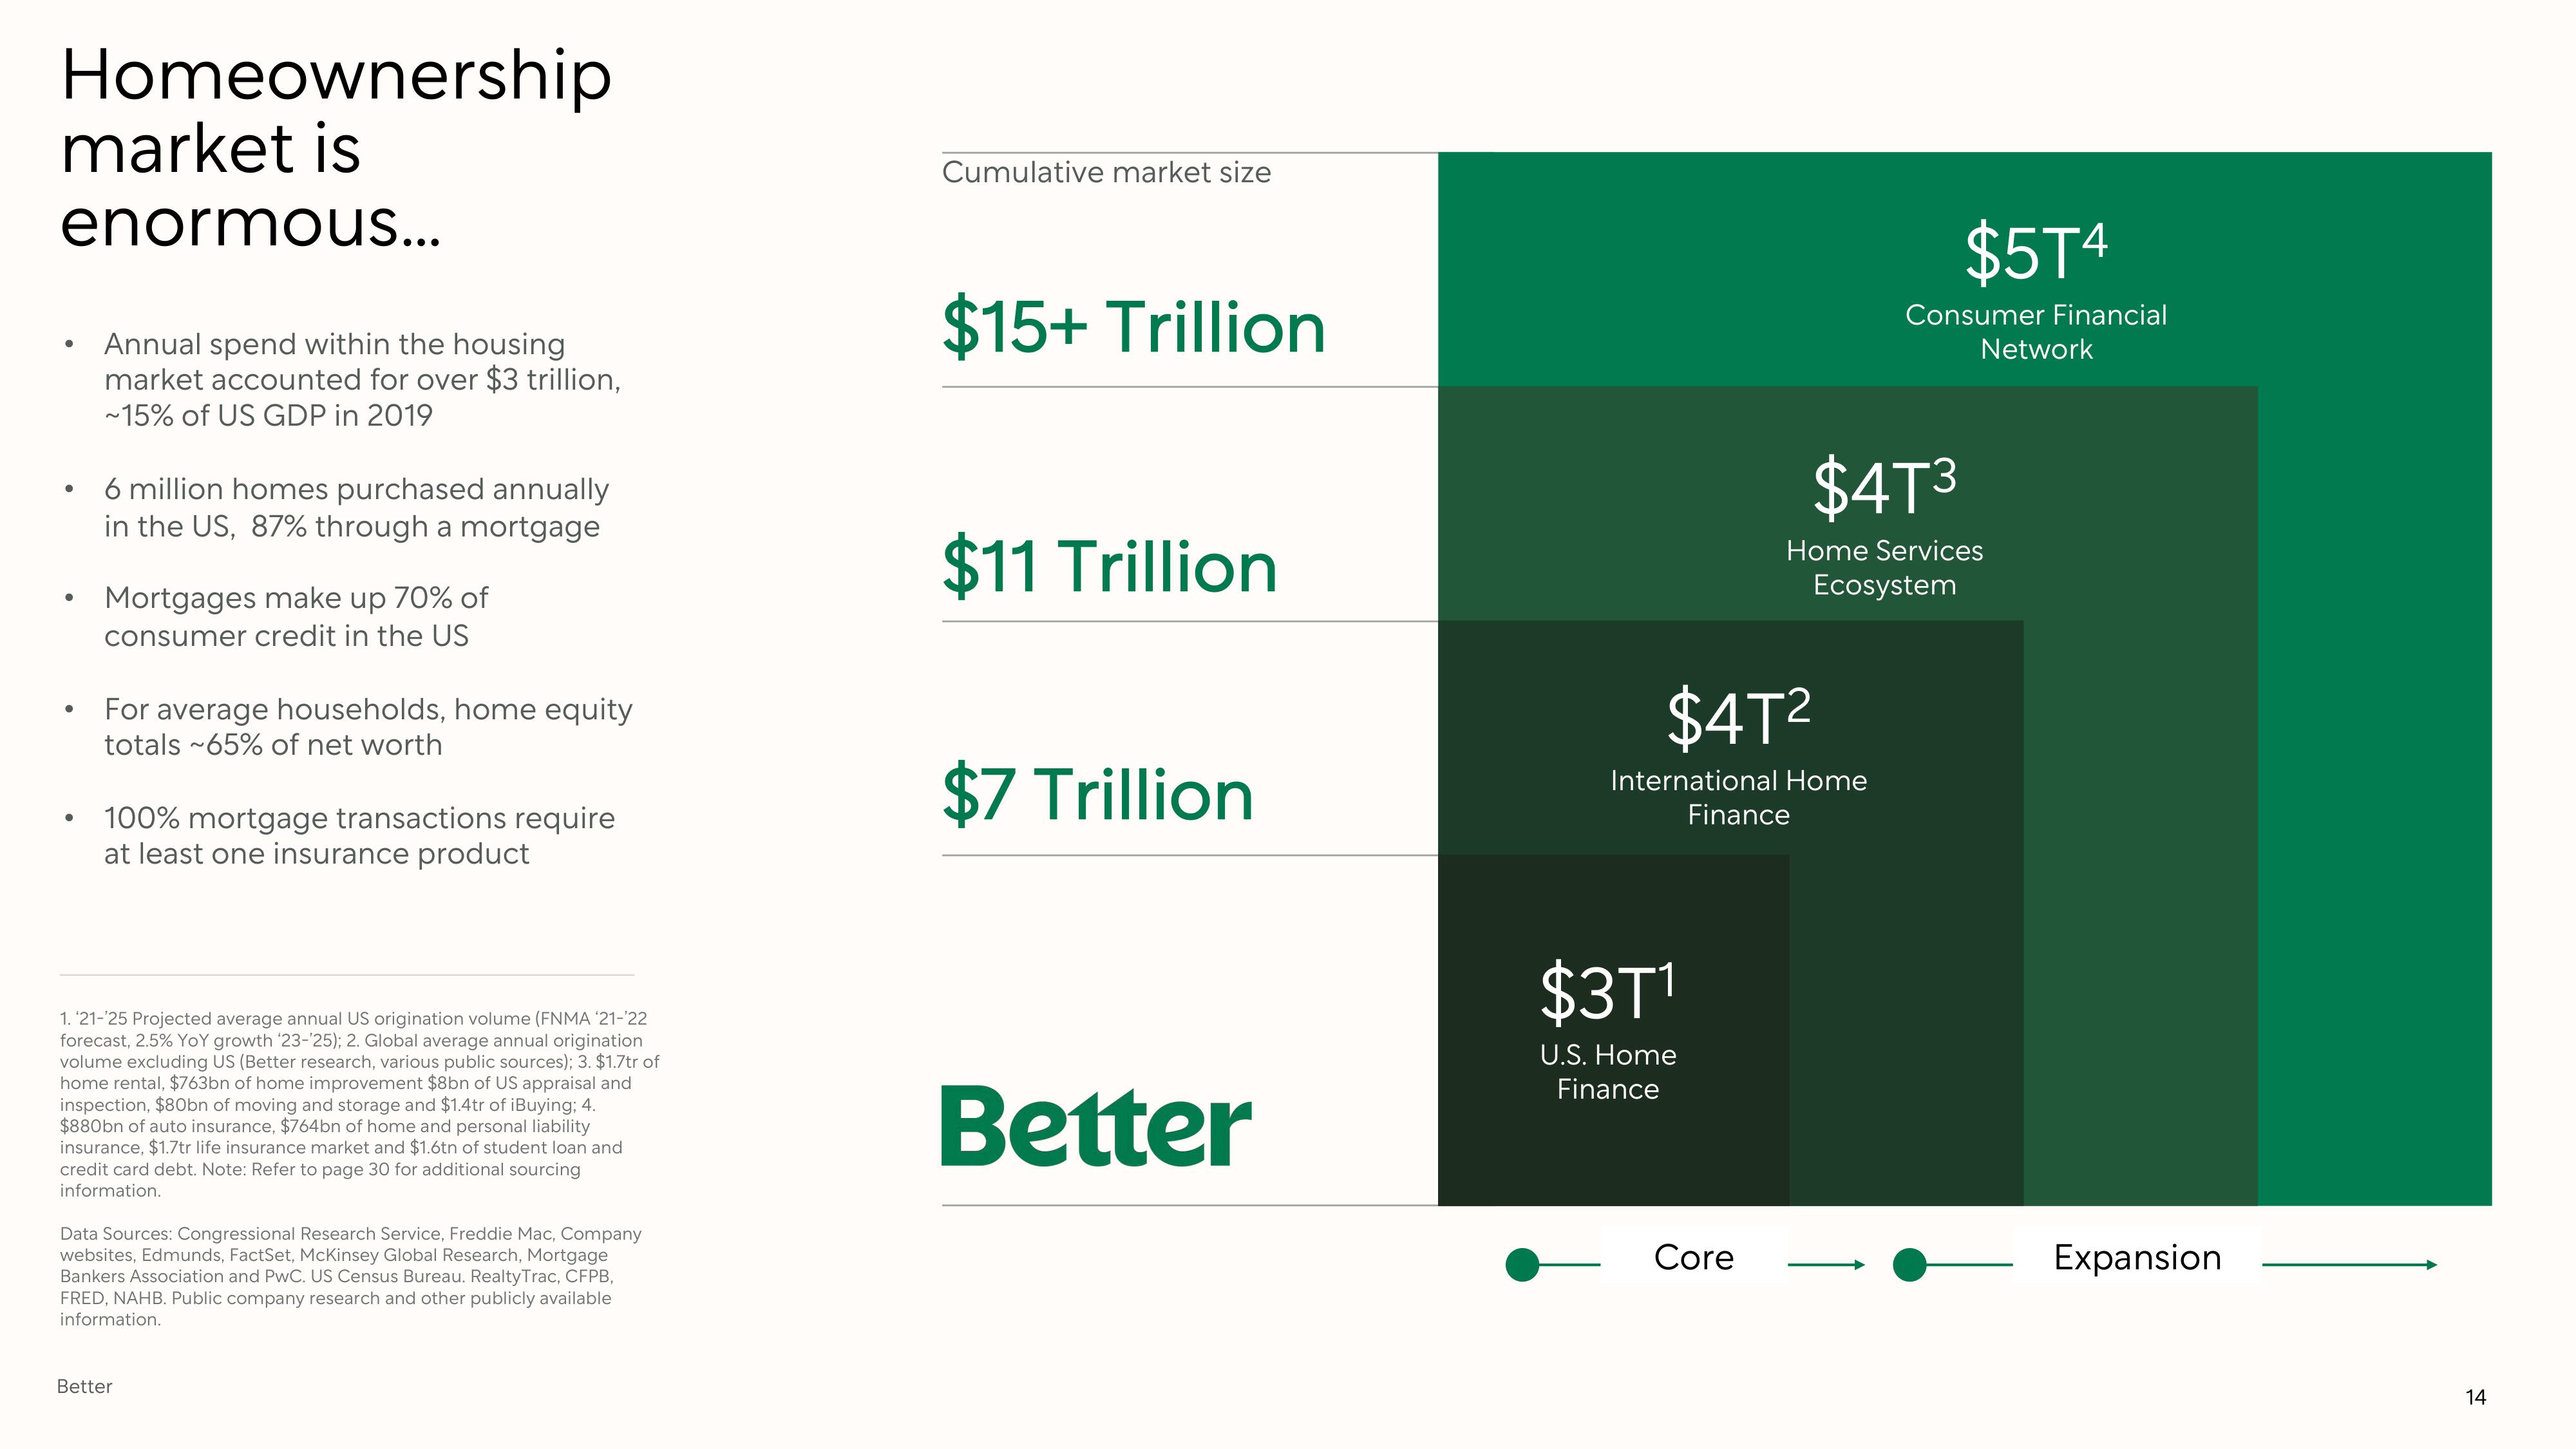
Cumulative market size
$15+ Trillion
$11 Trillion
$7 Trillion
Better
$4T²
International Home
Finance
$3T¹
U.S. Home
Finance
Core
$5T4
Consumer Financial
Network
$4T3
Home Services
Ecosystem
Expansion
14View entire presentation