Credit Suisse Investment Banking Pitch Book
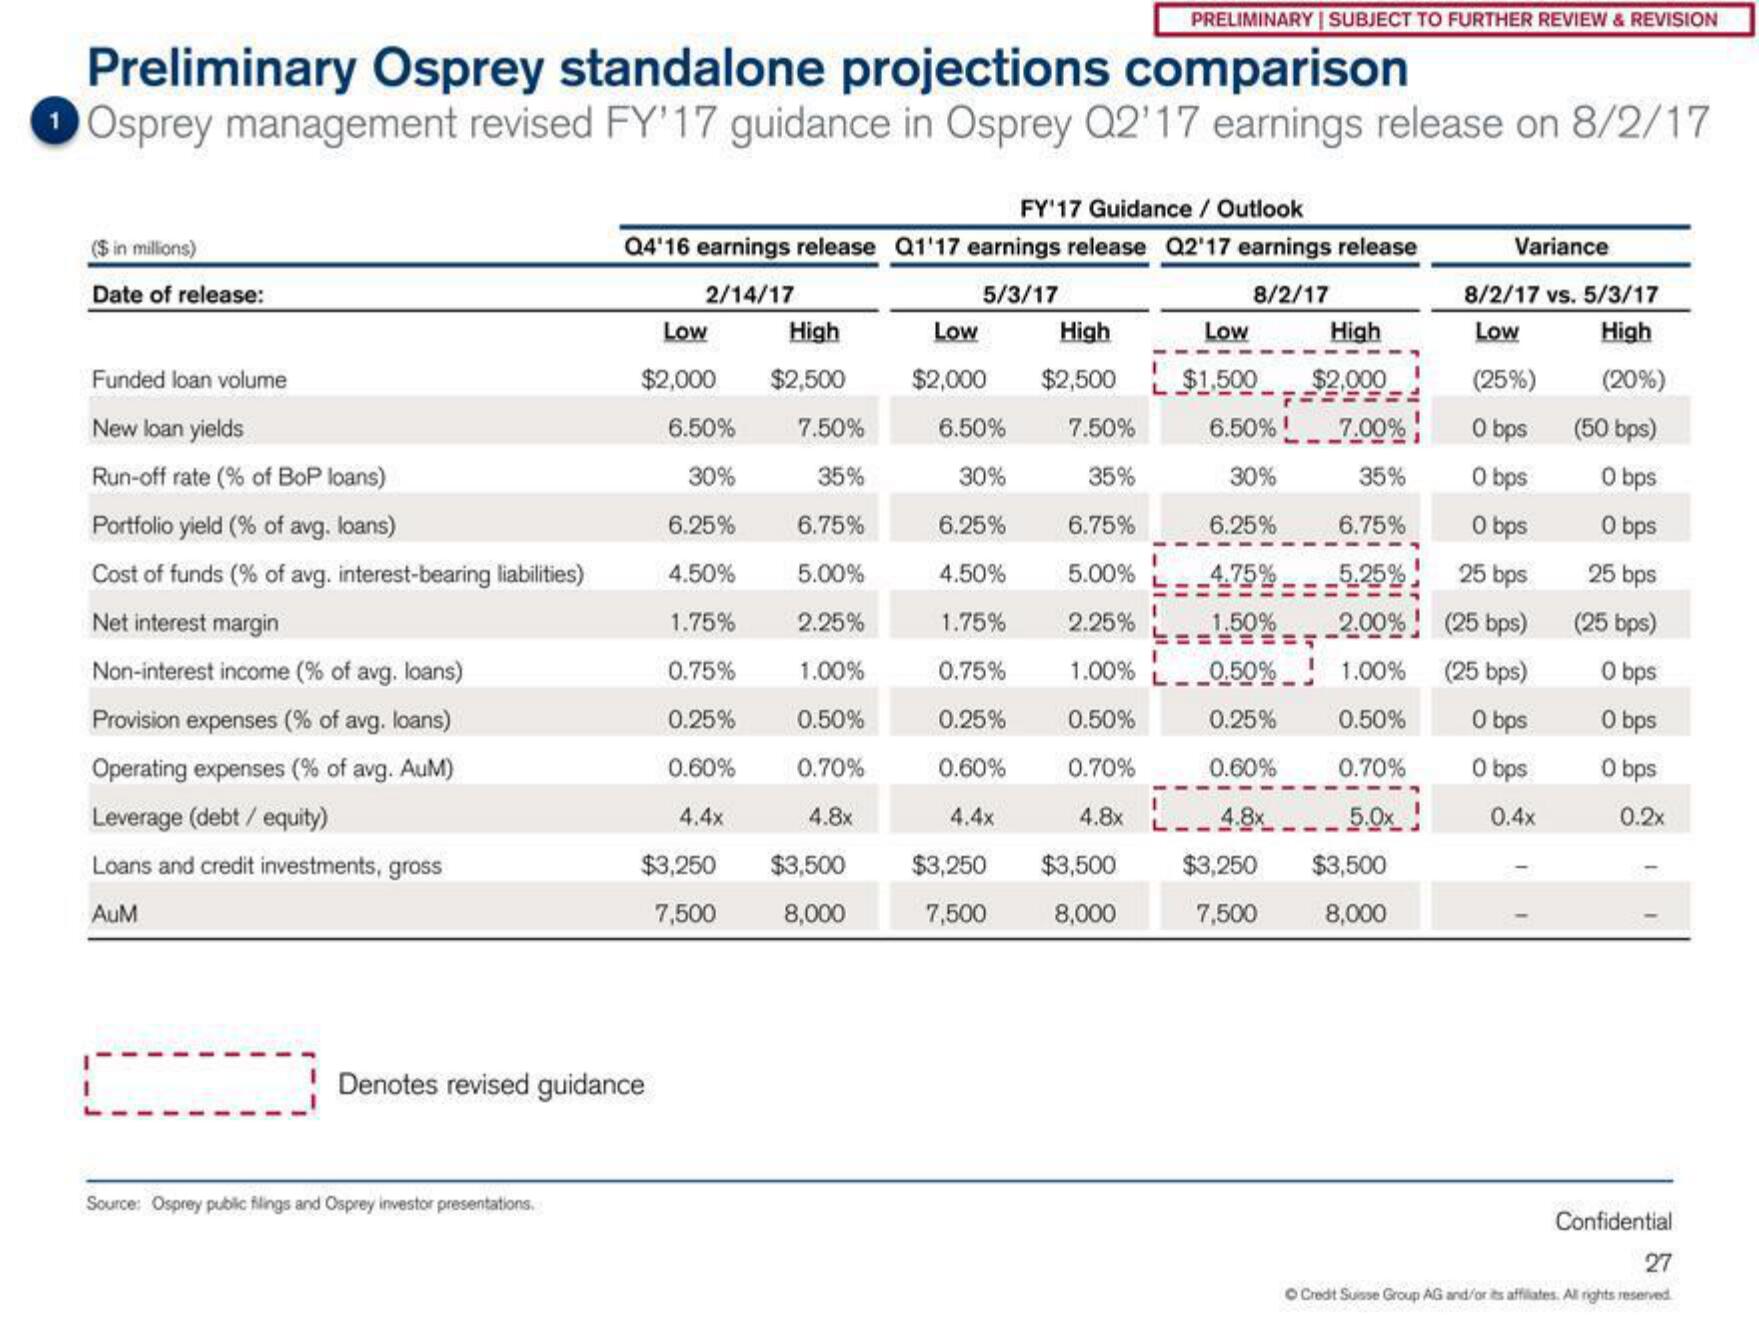
Preliminary Osprey standalone projections comparison
Osprey management revised FY'17 guidance in Osprey Q2'17 earnings release on 8/2/17
($ in millions)
Date of release:
Funded loan volume
New loan yields
Run-off rate (% of BoP loans)
Portfolio yield (% of avg. loans)
Cost of funds (% of avg. interest-bearing liabilities)
Net interest margin
Non-interest income (% of avg. loans)
Provision expenses (% of avg. loans)
Operating expenses (% of avg. AuM)
Leverage (debt / equity)
Loans and credit investments, gross
AUM
Source: Osprey public filings and Osprey investor presentations.
FY'17 Guidance / Outlook
Q4'16 earnings release Q1'17 earnings release Q2'17 earnings release
2/14/17
5/3/17
8/2/17
Low
$2,000
Denotes revised guidance
6.50%
30%
6.25%
4.50%
1.75%
0.75%
0.25%
0.60%
4.4x
$3,250
7,500
Low
High
$2,500 $2,000
7.50%
6.50%
35%
30%
6.75%
6.25%
5.00%
4.50%
2.25%
1.75%
1.00%
0.75%
0.50%
0.25%
0.70%
0.60%
4.8x
4.4x
$3,250 $3,500
7,500
8,000
PRELIMINARY | SUBJECT TO FURTHER REVIEW & REVISION
$3,500
8,000
High
$2,500
7.50%
35%
6.75%
5.00%
2.25%
1.00%
L__0.50%
0.50%
0.25%
0.70%
0.60%
4.8× L-4.8x_
1
Low
High
$1,500 $2,000
6.50%!
7.00%
30%
35%
6.25% 6.75%
4.75%
5.25%
1.50%
2.00%
1.00%
0.50%
0.70%
5.0x
$3,250 $3,500
7,500
8,000
F
Variance
8/2/17 vs. 5/3/17
Low
High
(25%)
0 bps
0 bps
0 bps
25 bps
(25 bps)
(25 bps)
0 bps
0 bps
0.4x
(20%)
(50 bps)
0 bps
0 bps
25 bps
(25 bps)
0 bps
0 bps
0 bps
0.2x
Confidential
27
Ⓒ Credit Suisse Group AG and/or its affiliates. All rights reserved.View entire presentation