Wix Results Presentation Deck
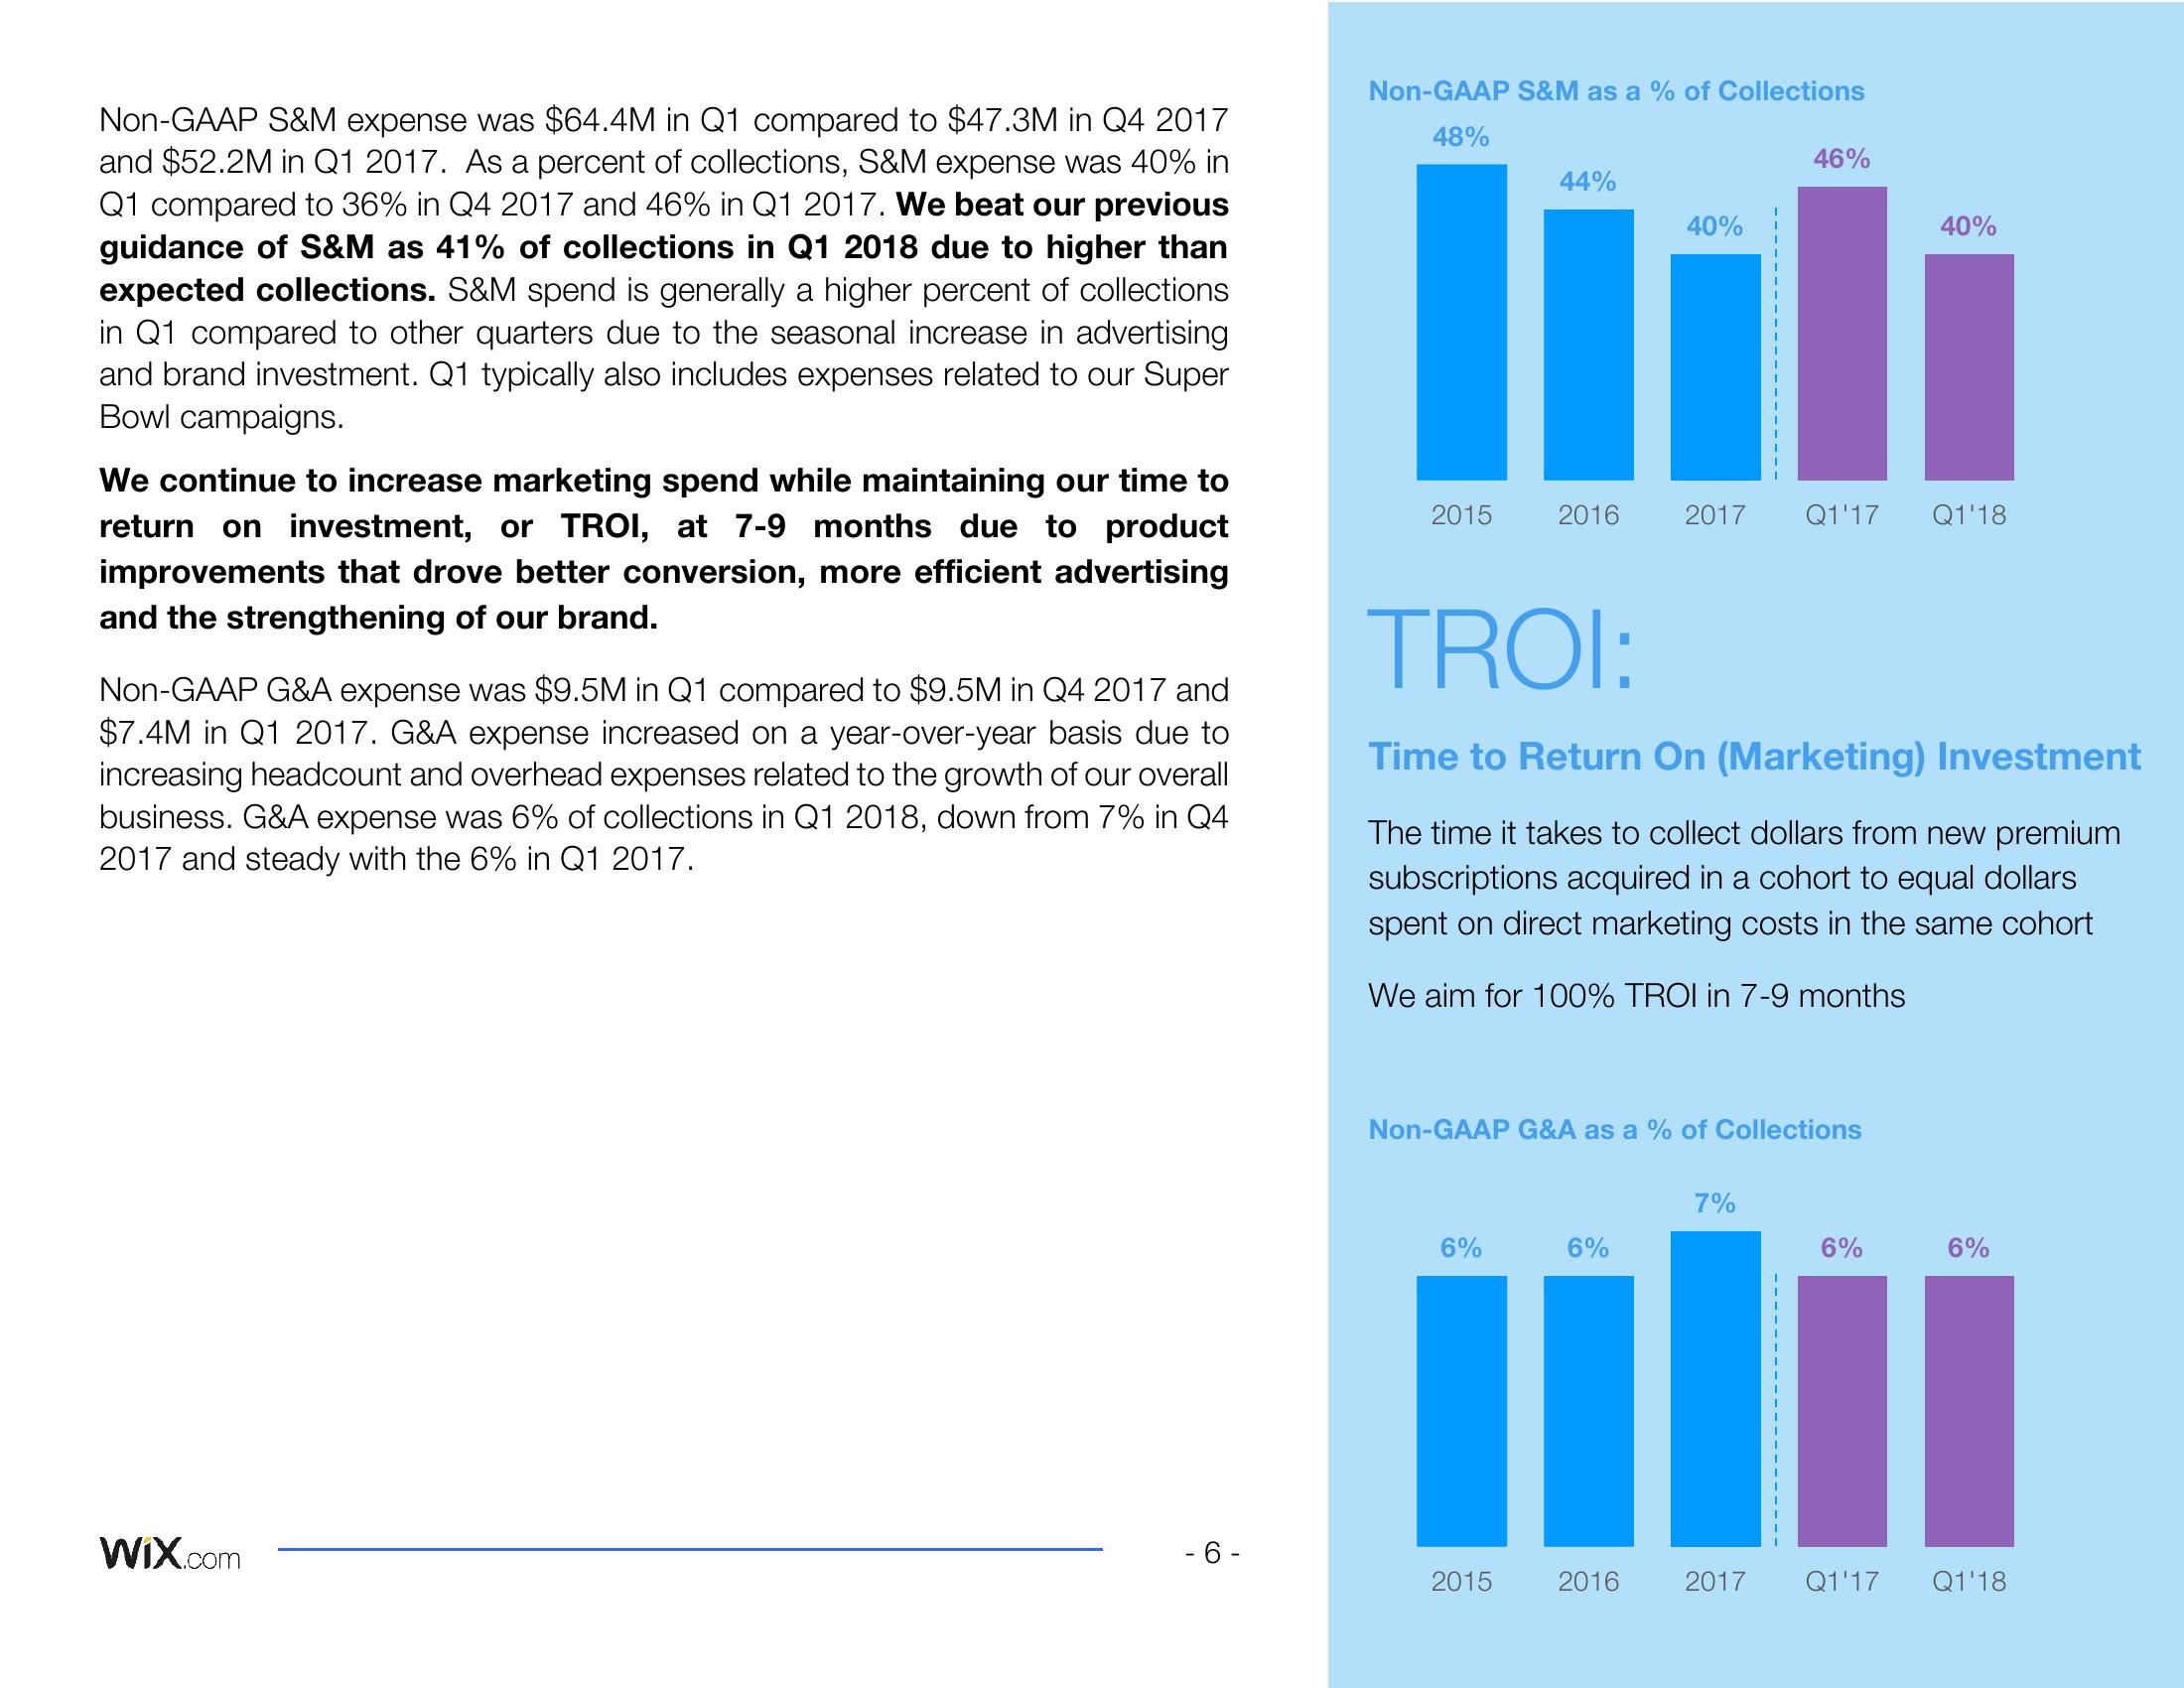
Non-GAAP S&M expense was $64.4M in Q1 compared to $47.3M in Q4 2017
and $52.2M in Q1 2017. As a percent of collections, S&M expense was 40% in
Q1 compared to 36% in Q4 2017 and 46% in Q1 2017. We beat our previous
guidance of S&M as 41% of collections in Q1 2018 due to higher than
expected collections. S&M spend is generally a higher percent of collections
in Q1 compared to other quarters due to the seasonal increase in advertising
and brand investment. Q1 typically also includes expenses related to our Super
Bowl campaigns.
We continue to increase marketing spend while maintaining our time to
return on investment, or TROI, at 7-9 months due to product
improvements that drove better conversion, more efficient advertising
and the strengthening of our brand.
Non-GAAP G&A expense was $9.5M in Q1 compared to $9.5M in Q4 2017 and
$7.4M in Q1 2017. G&A expense increased on a year-over-year basis due to
increasing headcount and overhead expenses related to the growth of our overall
business. G&A expense was 6% of collections in Q1 2018, down from 7% in Q4
2017 and steady with the 6% in Q1 2017.
Wix.com
- 6-
Non-GAAP S&M as a % of Collections
48%
44%
40%
Tili
2015
2016
6%
2017
2015
46%
TROI:
Time to Return On (Marketing) Investment
The time it takes to collect dollars from new premium
subscriptions acquired in a cohort to equal dollars
spent on direct marketing costs in the same cohort
We aim for 100% TROI in 7-9 months
Non-GAAP G&A as a % of Collections
2016
7%
6%
ili
Q1'17 Q1'18
2017
40%
6%
6%
Q1'17 Q1'18View entire presentation