Pershing Square Activist Presentation Deck
III. Pershing's Proposal to McDonald's:
McOpCo IPO
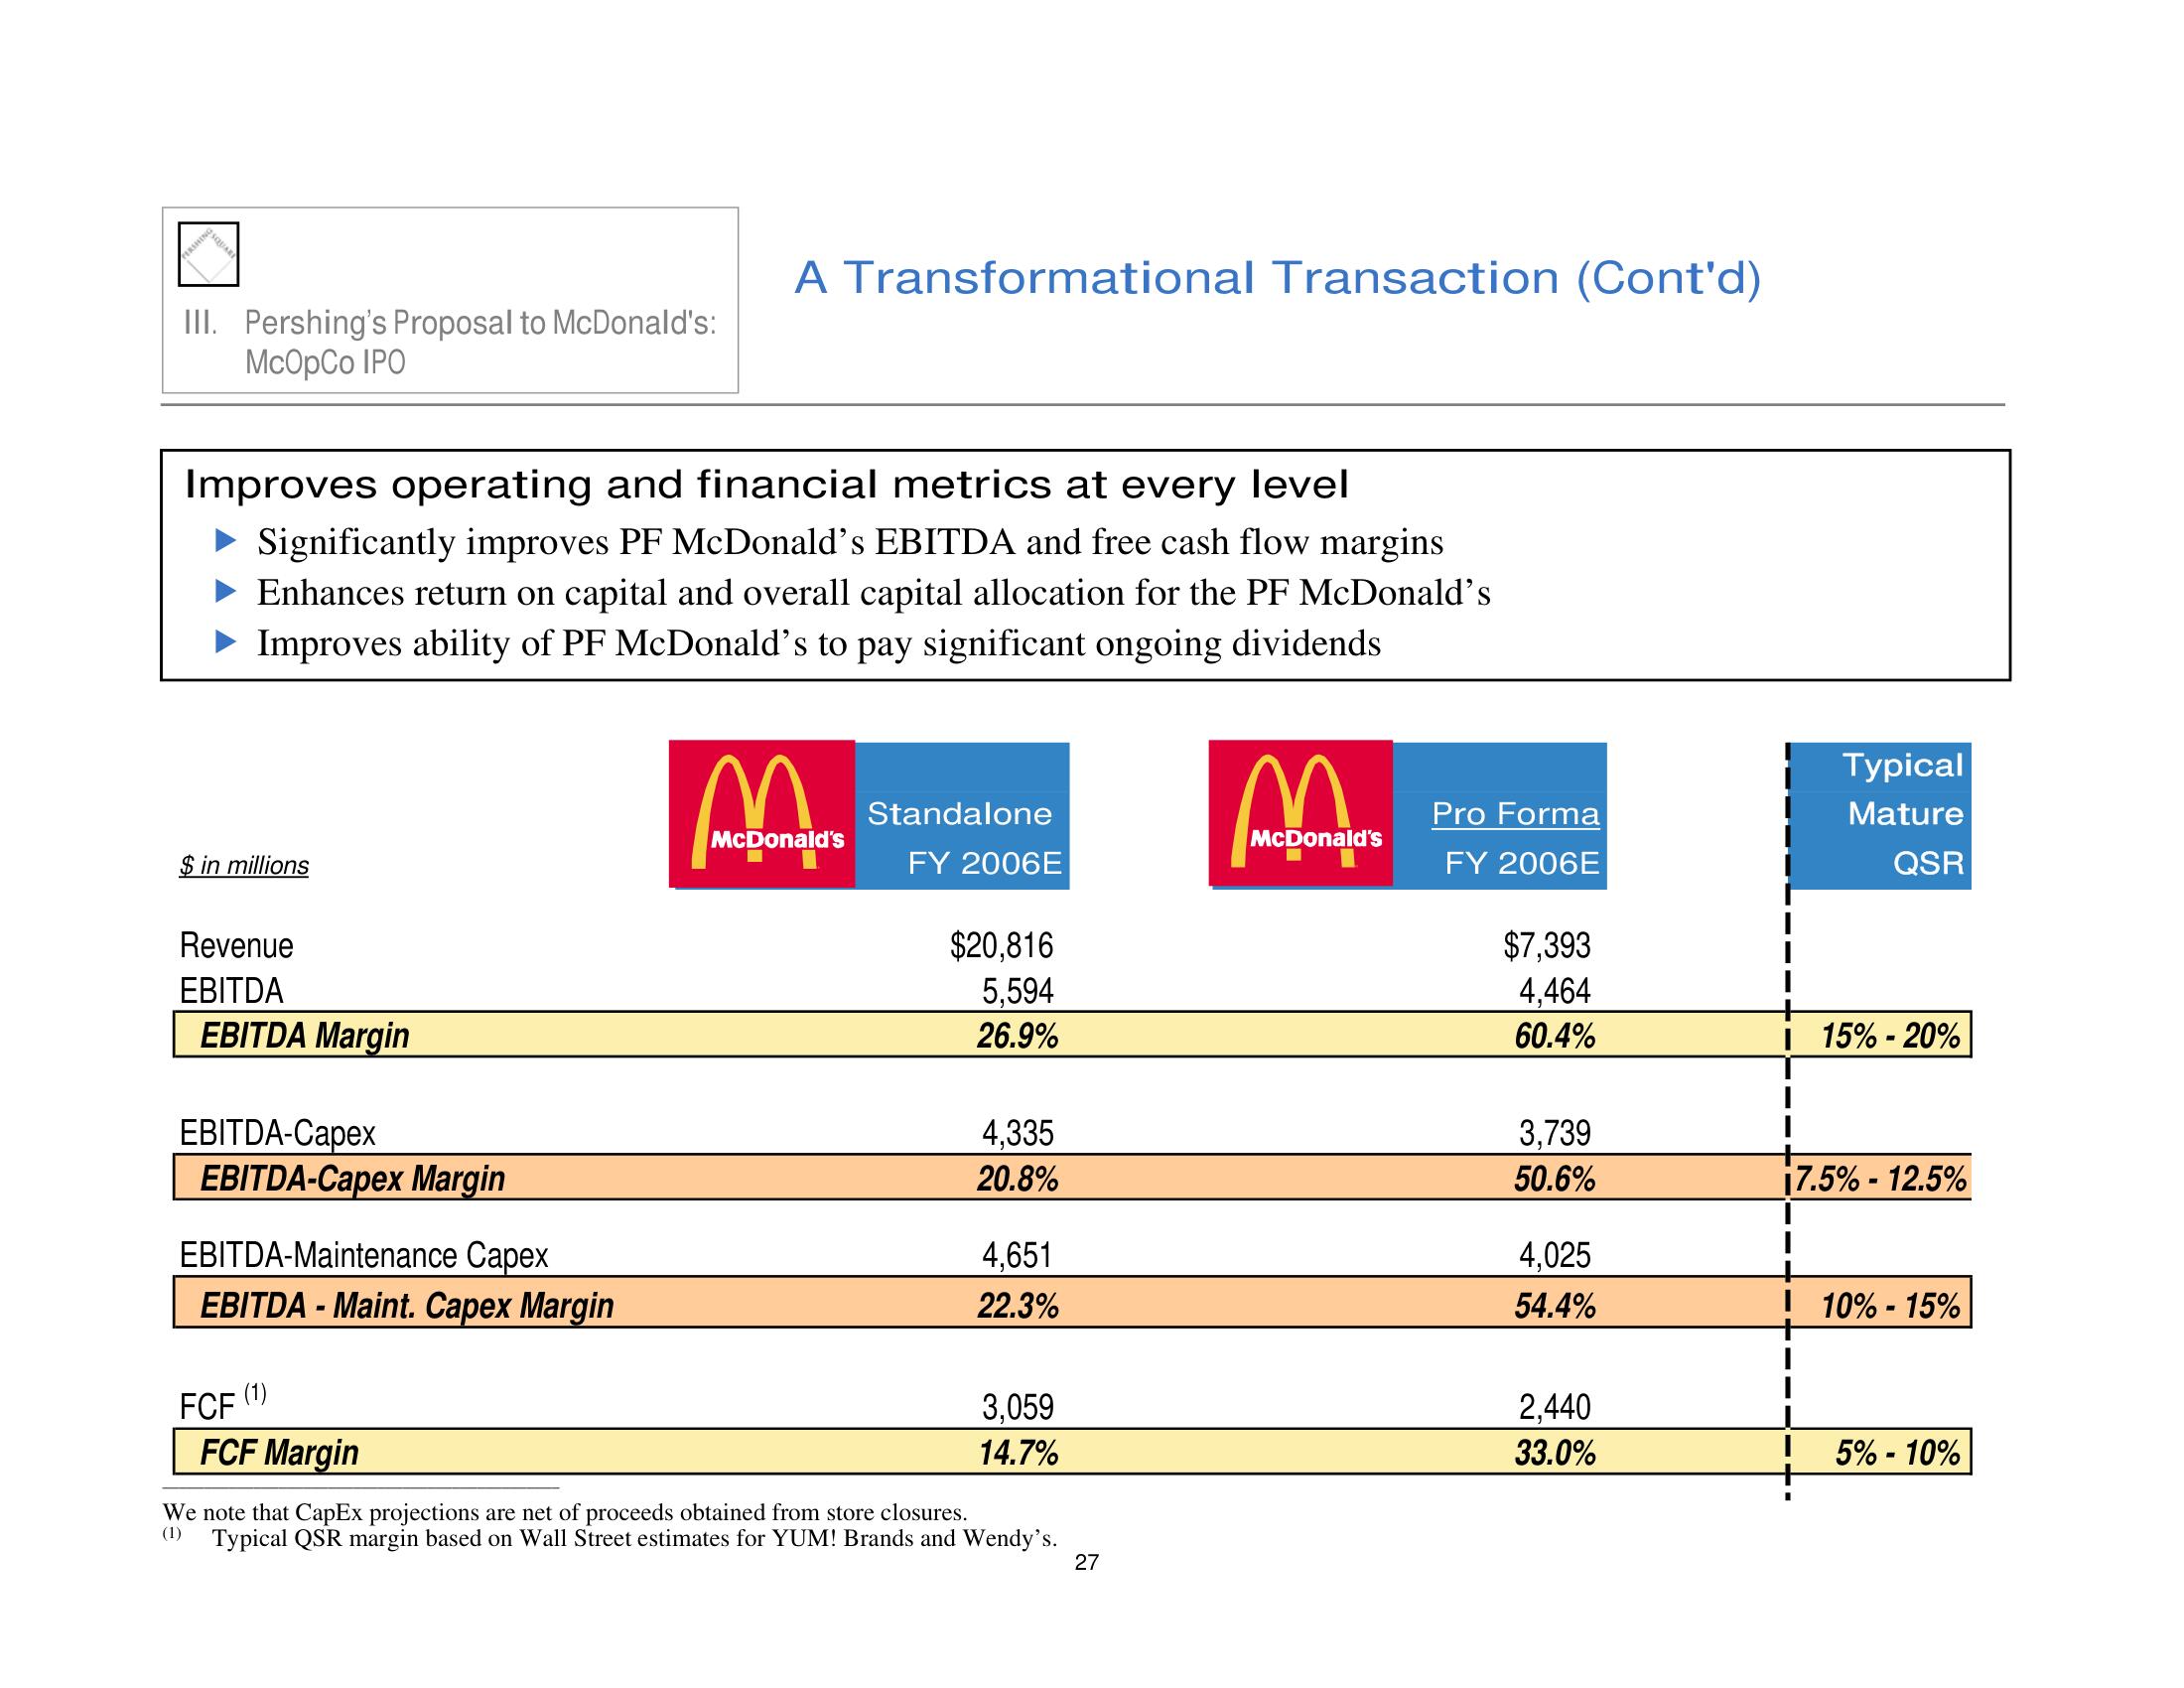
Improves operating and financial metrics at every level
Significantly improves PF McDonald's EBITDA and free cash flow margins
Enhances return on capital and overall capital allocation for the PF McDonald's
► Improves ability of PF McDonald's to pay significant ongoing dividends
$ in millions
Revenue
EBITDA
EBITDA Margin
EBITDA-Capex
EBITDA-Capex Margin
EBITDA-Maintenance Capex
EBITDA - Maint. Capex Margin
FCF
(1)
A Transformational Transaction (Cont'd)
FCF Margin
McDonald's
Standalone
FY 2006E
$20,816
5,594
26.9%
4,335
20.8%
4,651
22.3%
3,059
14.7%
We note that CapEx projections are net of proceeds obtained from store closures.
(1) Typical QSR margin based on Wall Street estimates for YUM! Brands and Wendy's.
27
M
McDonald's
Pro Forma
FY 2006E
$7,393
4,464
60.4%
3,739
50.6%
4,025
54.4%
2,440
33.0%
Typical
Mature
QSR
15% - 20%
¡7.5% -12.5%
10%-15%
5% - 10%View entire presentation