Fiverr Investor Presentation Deck slide image

Fiverr Investor Presentation Deck

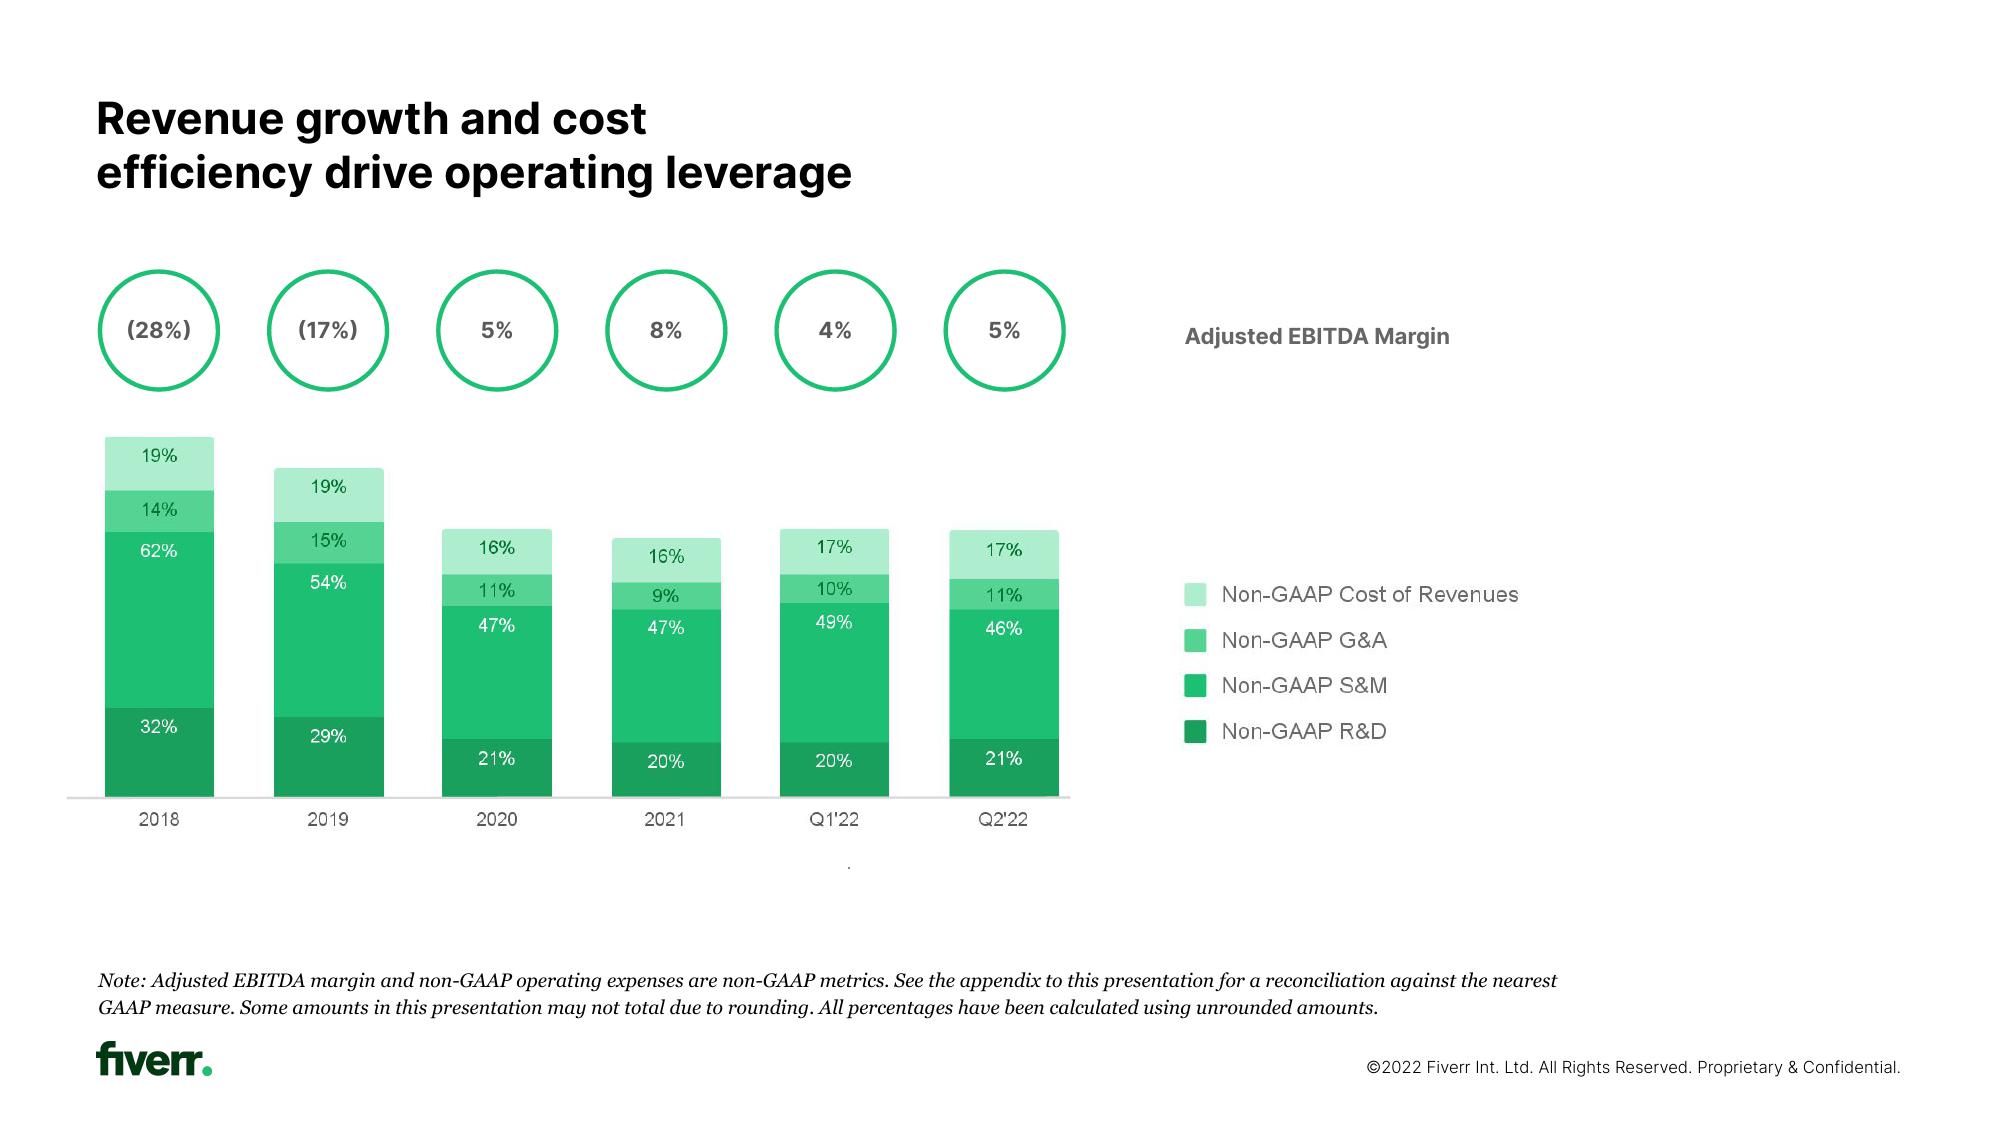
Revenue growth and cost efficiency drive operating leverage (28%) 19% 14% 62% 32% 2018 (17%) 19% 15% 54% 29% 2019 5% 16% 11% 47% 21% 2020 C 8% 16% 9% 47% 20% 2021 4% 17% 10% 49% 20% Q1'22 5% 17% 11% 46% 21% Q2'22 Adjusted EBITDA Margin Non-GAAP Cost of Revenues Non-GAAP G&A Non-GAAP S&M Non-GAAP R&D Note: Adjusted EBITDA margin and non-GAAP operating expenses are non-GAAP metrics. See the appendix to this presentation for a reconciliation against the nearest GAAP measure. Some amounts in this presentation may not total due to rounding. All percentages have been calculated using unrounded amounts. fiverr. Ⓒ2022 Fiverr Int. Ltd. All Rights Reserved. Proprietary & Confidential.
View entire presentation