Dave SPAC Presentation Deck
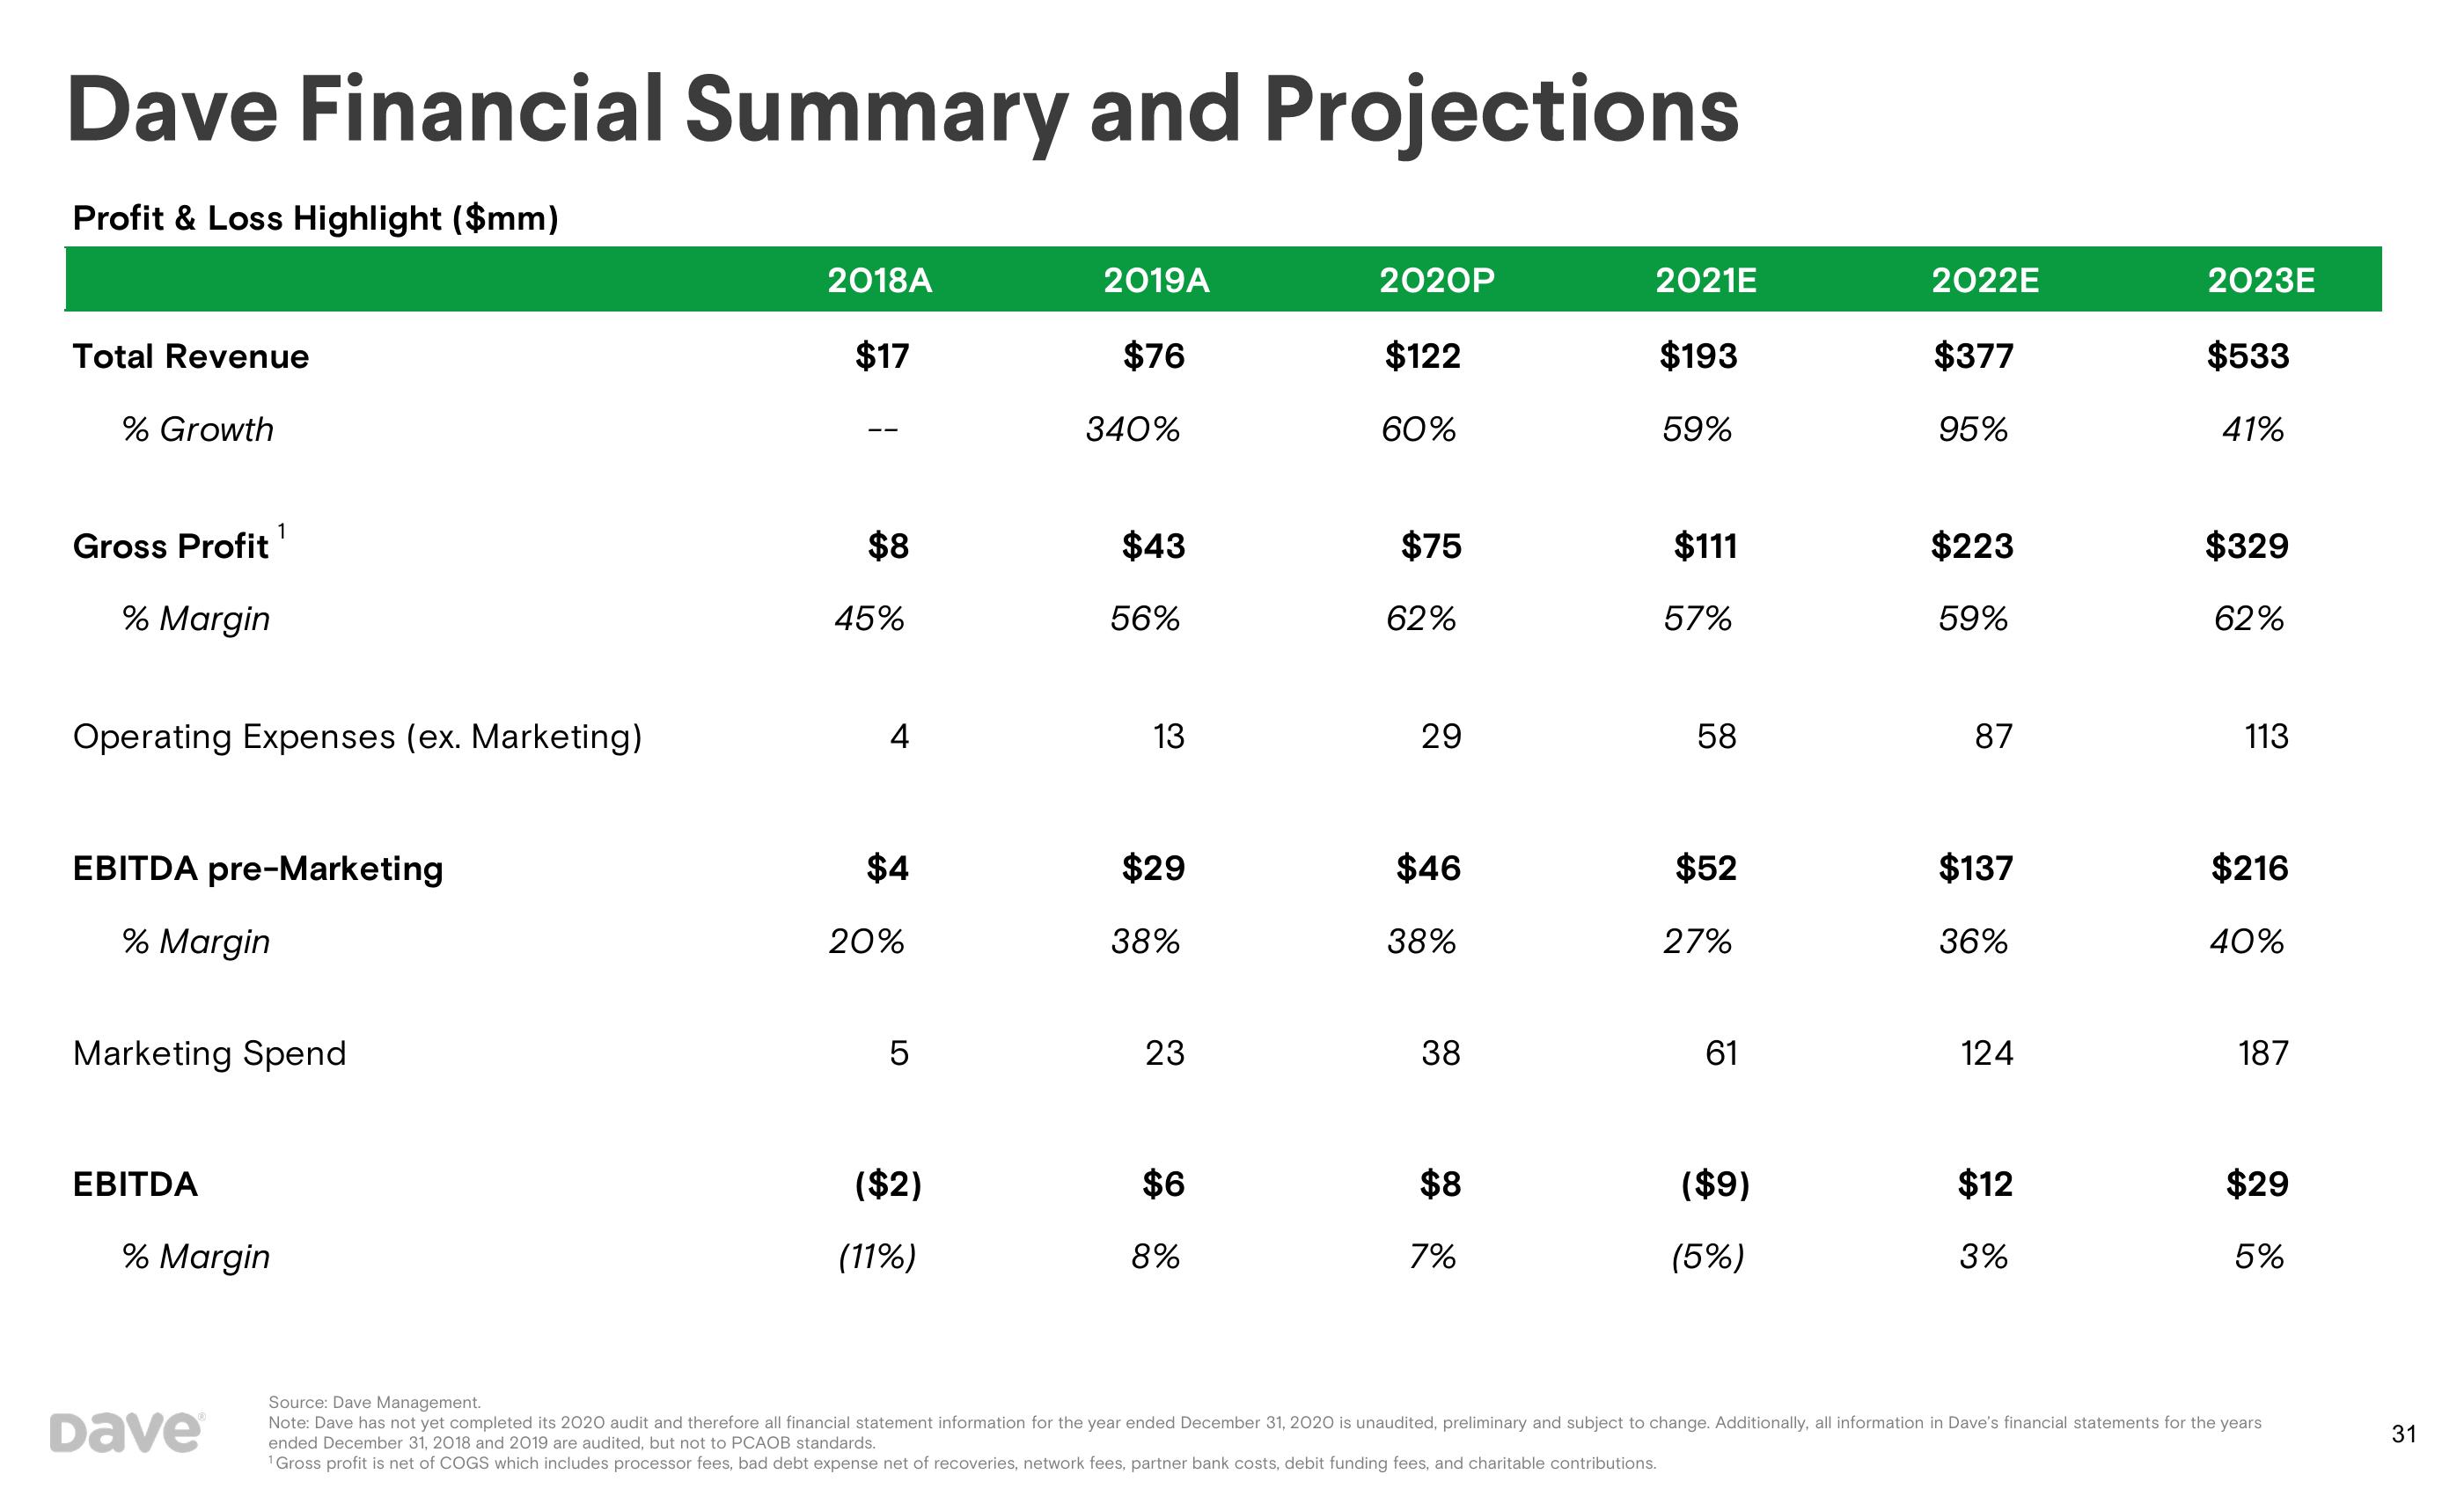
Dave Financial Summary and Projections
Profit & Loss Highlight ($mm)
Total Revenue
% Growth
1
Gross Profit¹
% Margin
Operating Expenses (ex. Marketing)
EBITDA pre-Marketing
% Margin
Marketing Spend
EBITDA
% Margin
Dave
2018A
$17
$8
45%
4
$4
20%
5
($2)
(11%)
2019A
$76
340%
$43
56%
13
$29
38%
23
$6
8%
2020P
$122
60%
$75
62%
29
$46
38%
38
$8
7%
2021E
$193
59%
$111
57%
58
$52
27%
61
($9)
(5%)
2022E
$377
95%
$223
59%
87
$137
36%
124
$12
3%
2023E
$533
41%
$329
62%
113
$216
40%
187
$29
5%
Source: Dave Management.
Note: Dave has not yet completed its 2020 audit and therefore all financial statement information for the year ended December 31, 2020 is unaudited, preliminary and subject to change. Additionally, all information in Dave's financial statements for the years
ended December 31, 2018 and 2019 are audited, but not to PCAOB standards.
¹ Gross profit is net of COGS which includes processor fees, bad debt expense net of recoveries, network fees, partner bank costs, debit funding fees, and charitable contributions.
31View entire presentation