SoftBank Results Presentation Deck
SVF2
PROGRESS & HIGHLIGHTS
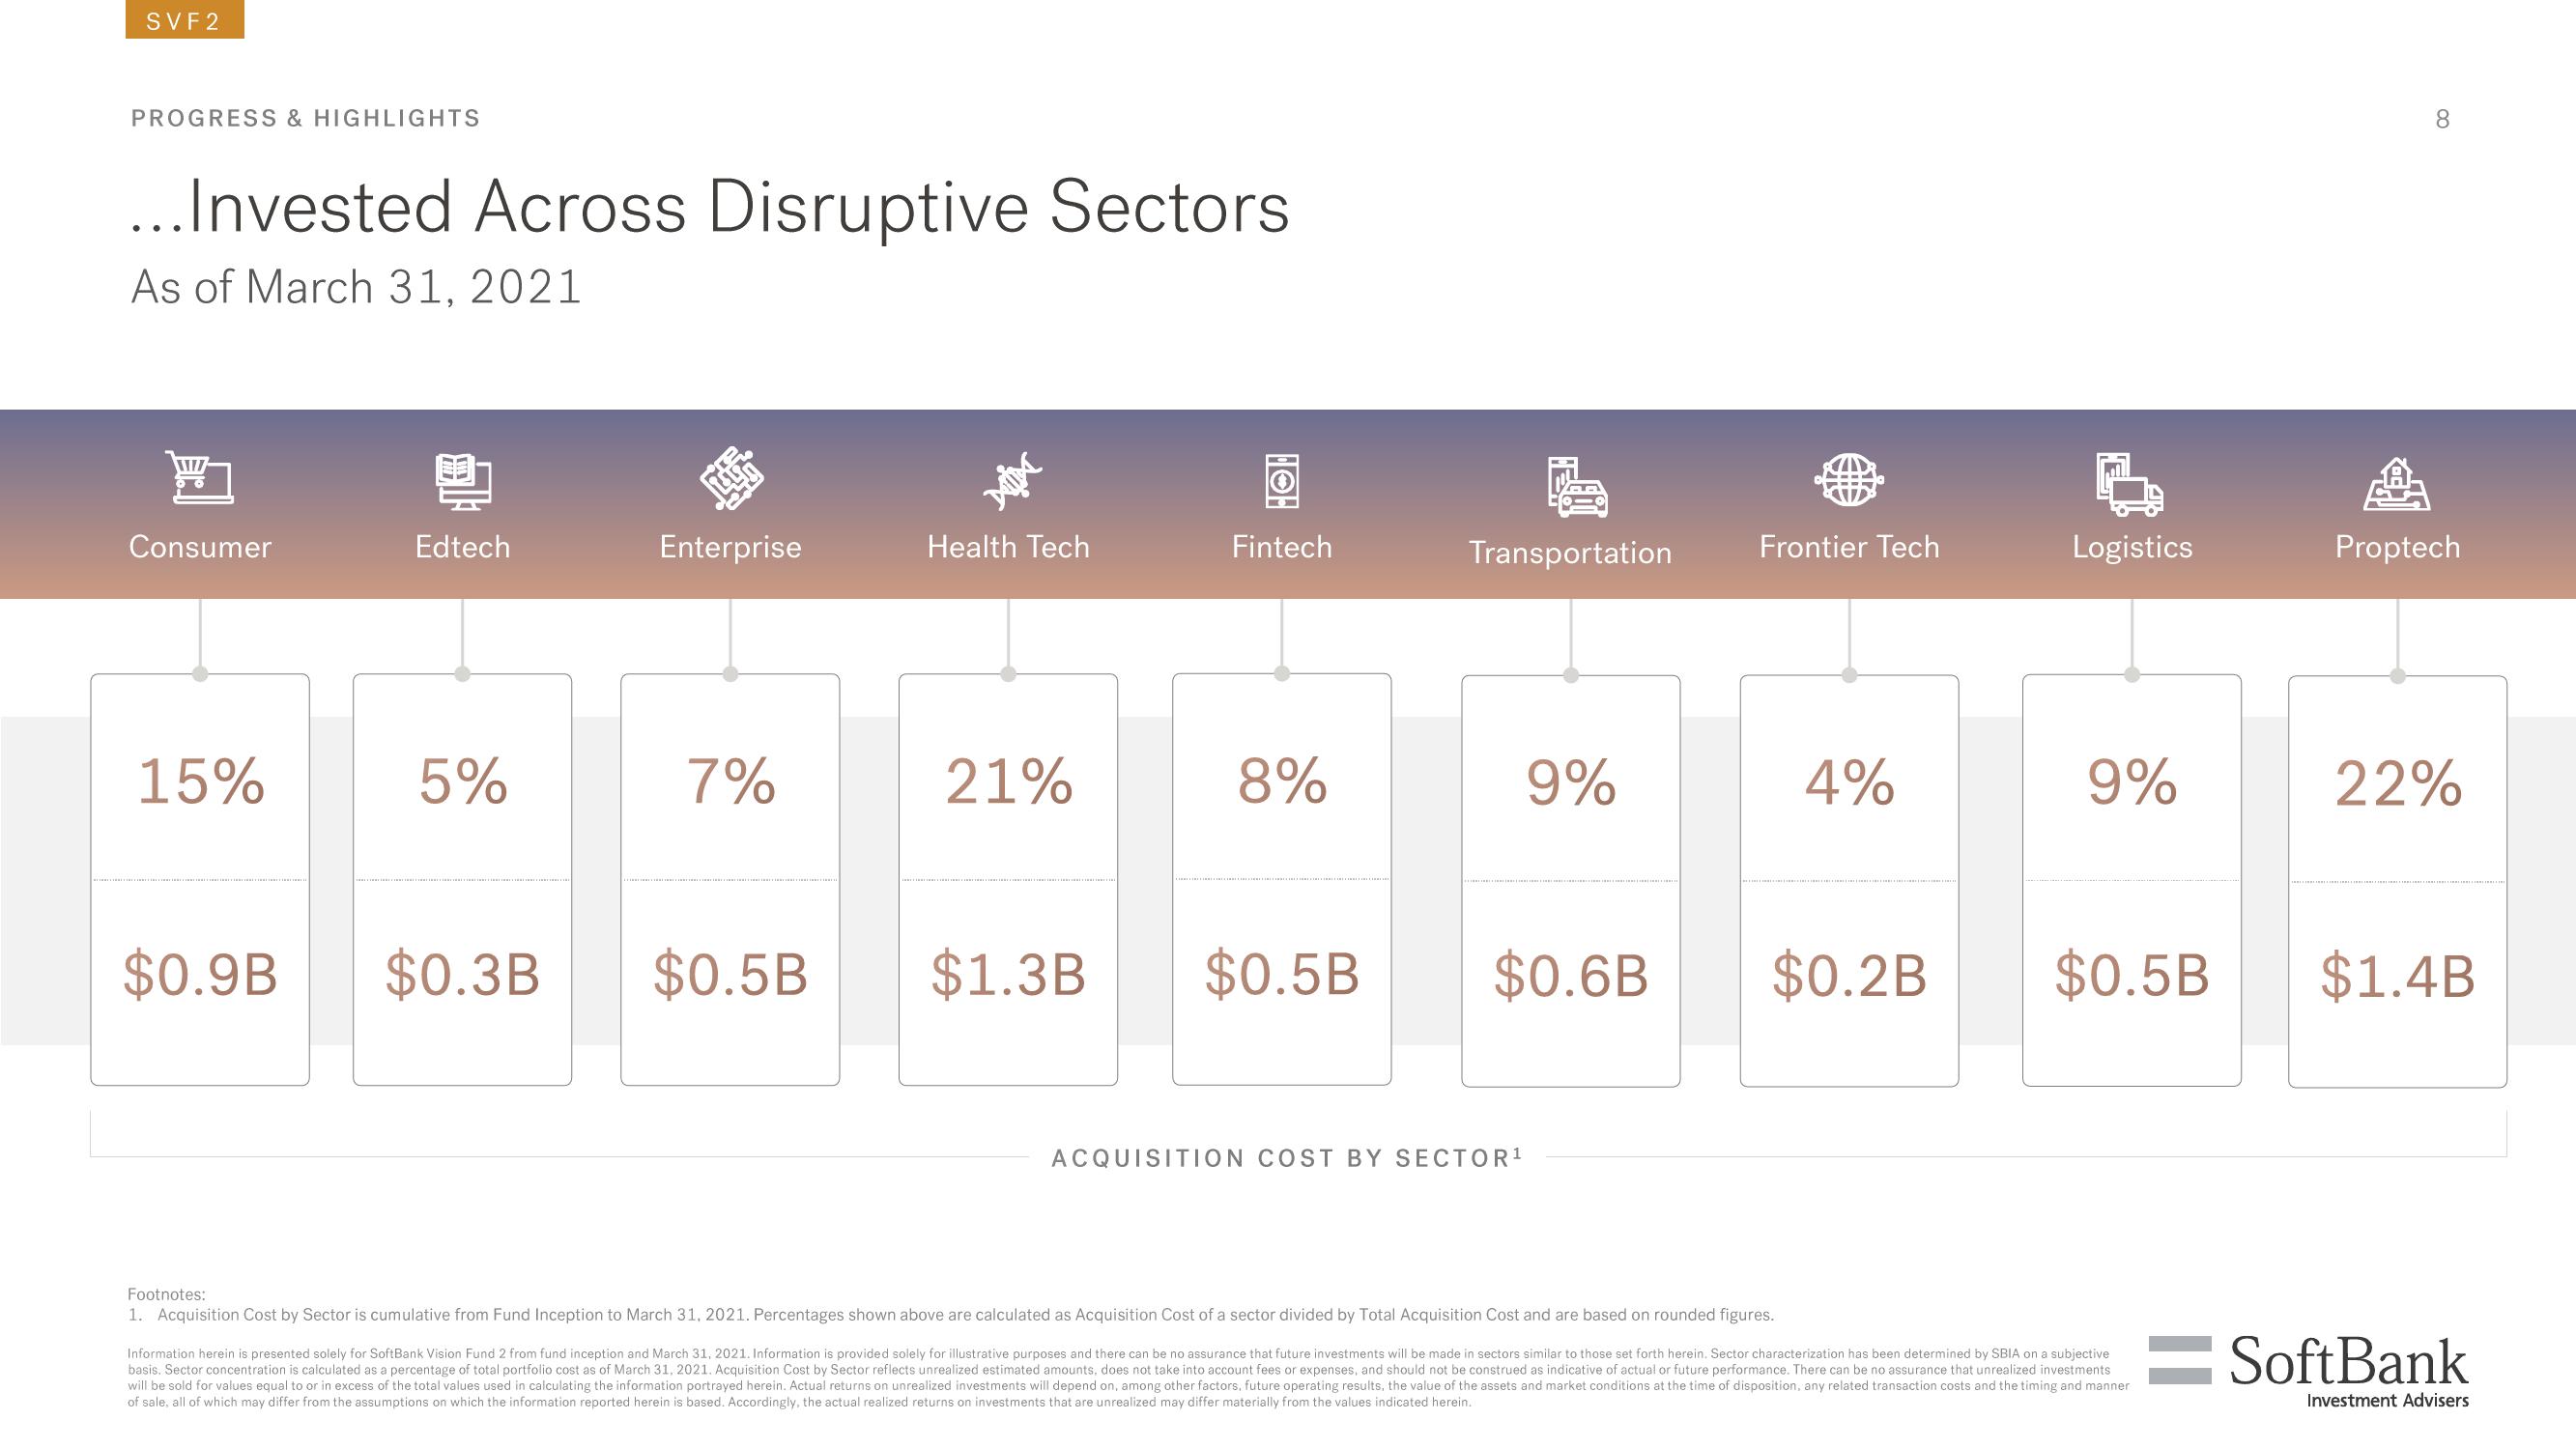
...Invested Across Disruptive Sectors
As of March 31, 2021
Consumer
15%
$0.9B
2
Edtech
5%
$0.3B
Enterprise
7%
$0.5B
Health Tech
21%
$1.3B
Fintech
8%
$0.5B
Transportation
9%
$0.6B
ACQUISITION COST BY SECTOR ¹
Frontier Tech
4%
$0.2B
Logistics
9%
$0.5B
Footnotes:
1. Acquisition Cost by Sector is cumulative from Fund Inception to March 31, 2021. Percentages shown above are calculated as Acquisition Cost of a sector divided by Total Acquisition Cost and are based on rounded figures.
Information herein is presented solely for SoftBank Vision Fund 2 from fund inception and March 31, 2021. Information is provided solely for illustrative purposes and there can be no assurance that future investments will be made in sectors similar to those set forth herein. Sector characterization has been determined by SBIA on a subjective
basis. Sector concentration is calculated as a percentage of total portfolio cost as of March 31, 2021. Acquisition Cost by Sector reflects unrealized estimated amounts, does not take into account fees or expenses, and should not be construed as indicative of actual or future performance. There can be no assurance that unrealized investments
will be sold for values equal to or in excess of the total values used in calculating the information portrayed herein. Actual returns on unrealized investments will depend on, among other factors, future operating results, the value of the assets and market conditions at the time of disposition, any related transaction costs and the timing and manner
of sale, all of which may differ from the assumptions on which the information reported herein is based. Accordingly, the actual realized returns on investments that are unrealized may differ materially from the values indicated herein.
8
Proptech
22%
$1.4B
SoftBank
Investment AdvisersView entire presentation