Wirecard Results Presentation Deck
■
Transaction Volume
in EUR billion
56.2
H1 2018
Organic and M&A Related Growth
32.9%
organic
2.6
74.7
H1 2019
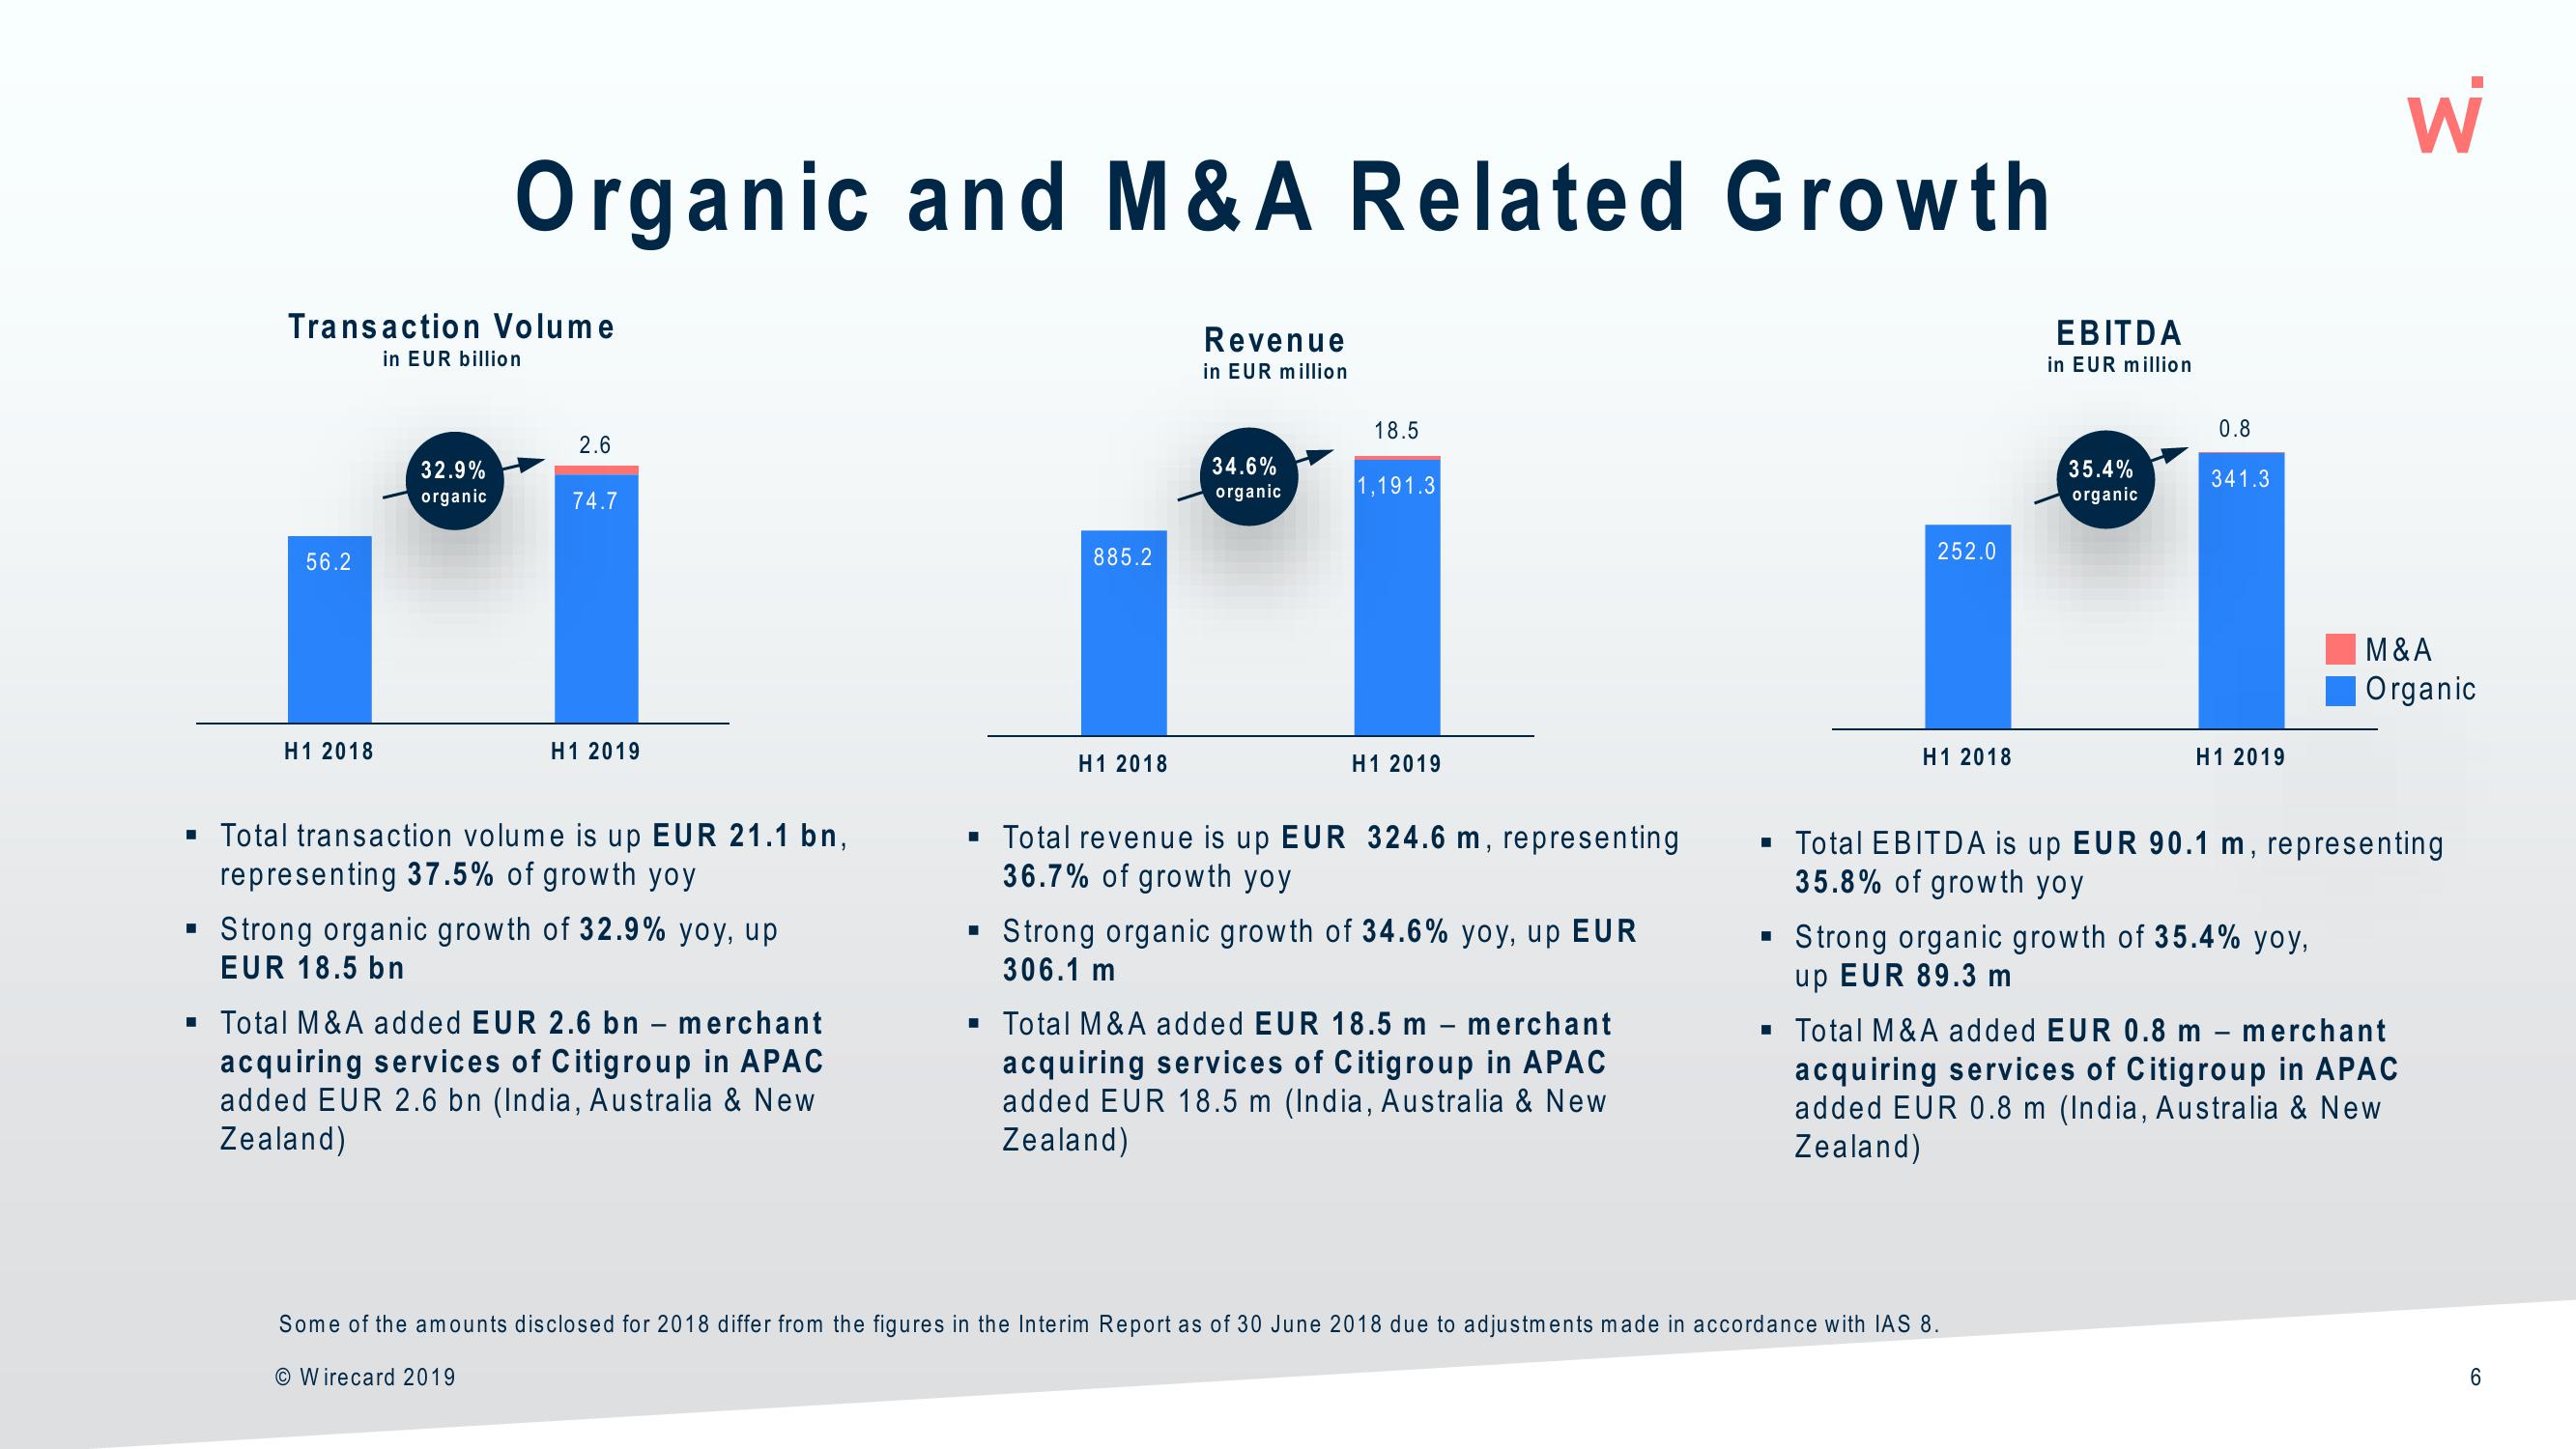
▪ Total transaction volume is up EUR 21.1 bn,
representing 37.5% of growth yoy
Strong organic growth of 32.9% yoy, up
EUR 18.5 bn
▪ Total M&A added EUR 2.6 bn - merchant
acquiring services of Citigroup in APAC
added EUR 2.6 bn (India, Australia & New
Zealand)
885.2
■
H1 2018
Revenue
in EUR million
34.6%
organic
18.5
1,191.3
H1 2019
▪ Total revenue is up EUR 324.6 m, representing
36.7% of growth yoy
Strong organic growth of 34.6% yoy, up EUR
306.1 m
▪ Total M&A added EUR 18.5 m - merchant
acquiring services of Citigroup in APAC
added EUR 18.5 m (India, Australia & New
Zealand)
252.0
H1 2018
EBITDA
in EUR million
35.4%
organic
0.8
341.3
Some of the amounts disclosed for 2018 differ from the figures in the Interim Report as of 30 June 2018 due to adjustments made in accordance with IAS 8.
O Wirecard 2019
H1 2019
▪ Strong organic growth of 35.4% yoy,
up EUR 89.3 m
▪ Total EBITDA is up EUR 90.1 m, representing
35.8% of growth yoy
६.
M&A
Organic
▪ Total M&A added EUR 0.8 m merchant
acquiring services of Citigroup in APAC
added EUR 0.8 m (India, Australia & New
Zealand)
6
COView entire presentation