Keysight Technologies Q1 Fiscal Year 2023 Results
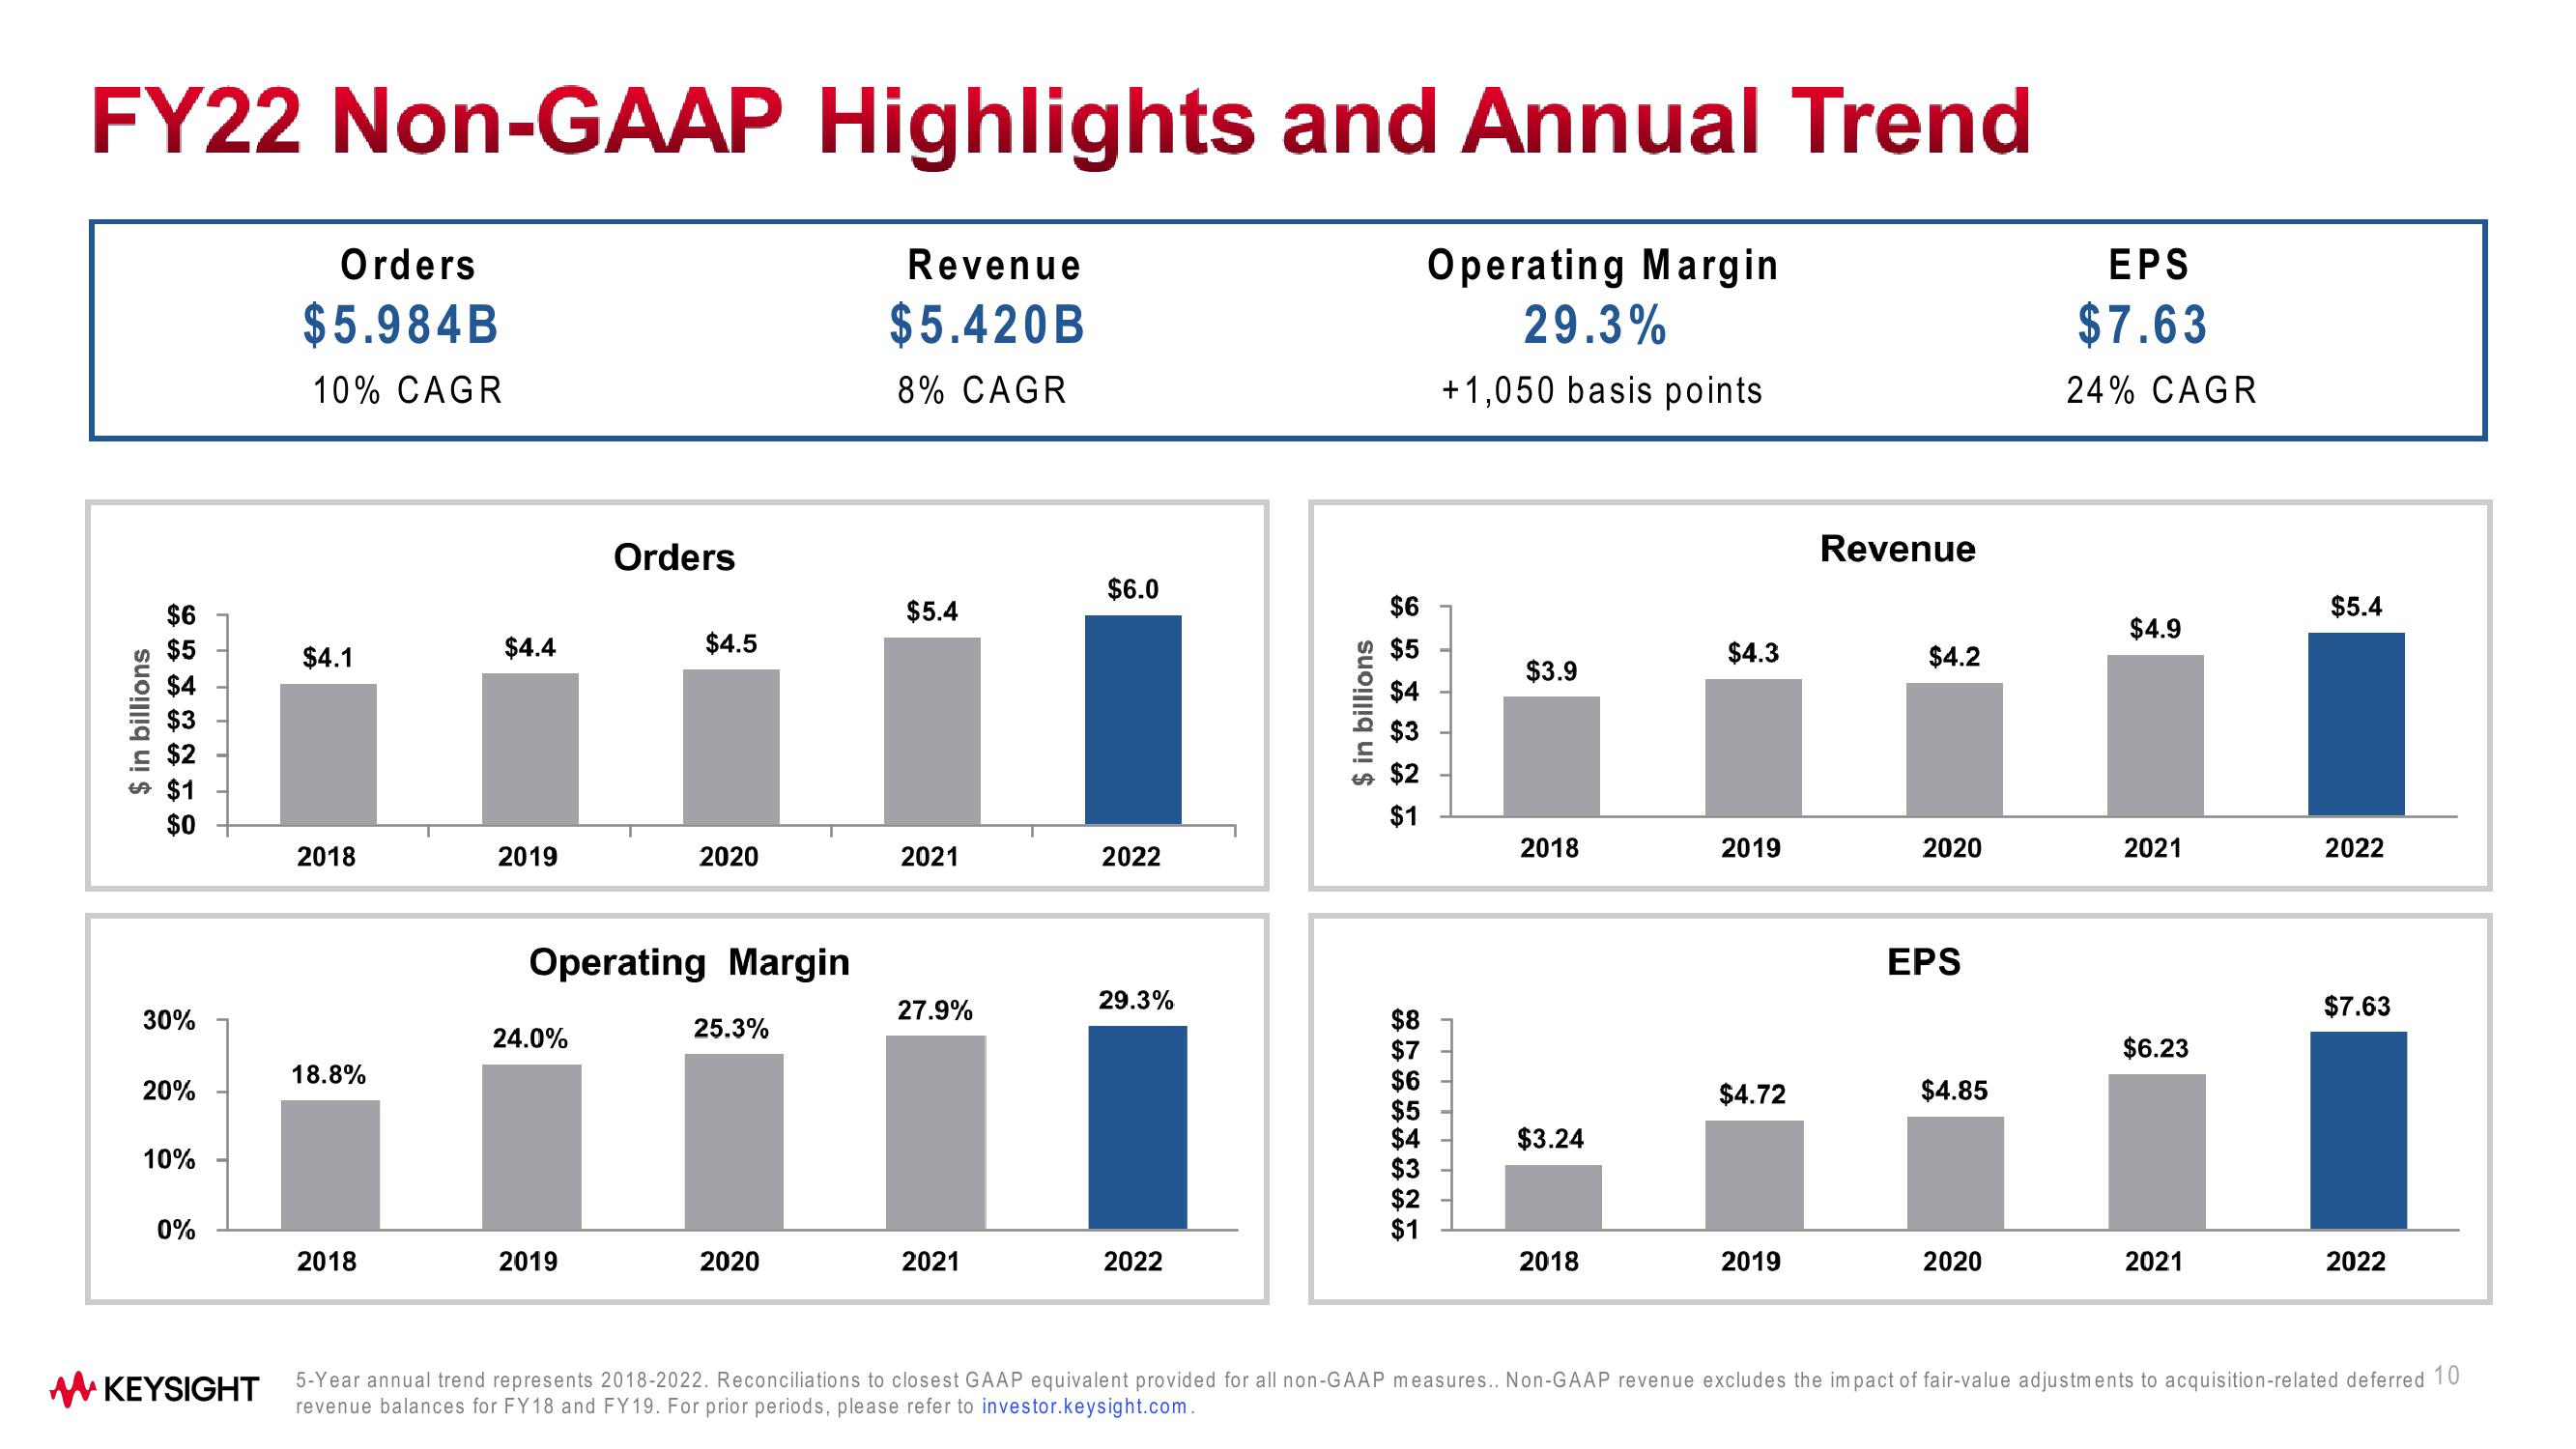
FY22 Non-GAAP Highlights and Annual Trend
Revenue
$5.420B
8% CAGR
$ in billions
$6
$5
$4
$3
$2
$1
$0
30%
20%
10%
0%
✔KEYSIGHT
Orders
$5.984B
10% CAGR
$4.1
2018
18.8%
2018
$4.4
2019
24.0%
Orders
2019
$4.5
Operating Margin
2020
25.3%
2020
$5.4
2021
27.9%
2021
$6.0
2022
29.3%
2022
$ in billions
$6
$5
$4
$2
$1
$8
$7
$6
$5
$4
$3
$2
$1
Operating Margin
29.3%
+1,050 basis points
$3.9
2018
$3.24
2018
$4.3
2019
$4.72
2019
Revenue
$4.2
2020
EPS
$4.85
2020
EPS
$7.63
24% CAGR
$4.9
2021
$6.23
2021
$5.4
2022
$7.63
2022
5-Year annual trend represents 2018-2022. Reconciliations to closest GAAP equivalent provided for all non-GAAP measures.. Non-GAAP revenue excludes the impact of fair-value adjustments to acquisition-related deferred 10
revenue balances for FY 18 and FY19. For prior periods, please refer to investor.keysight.com.View entire presentation