Ashtead Group Results Presentation Deck
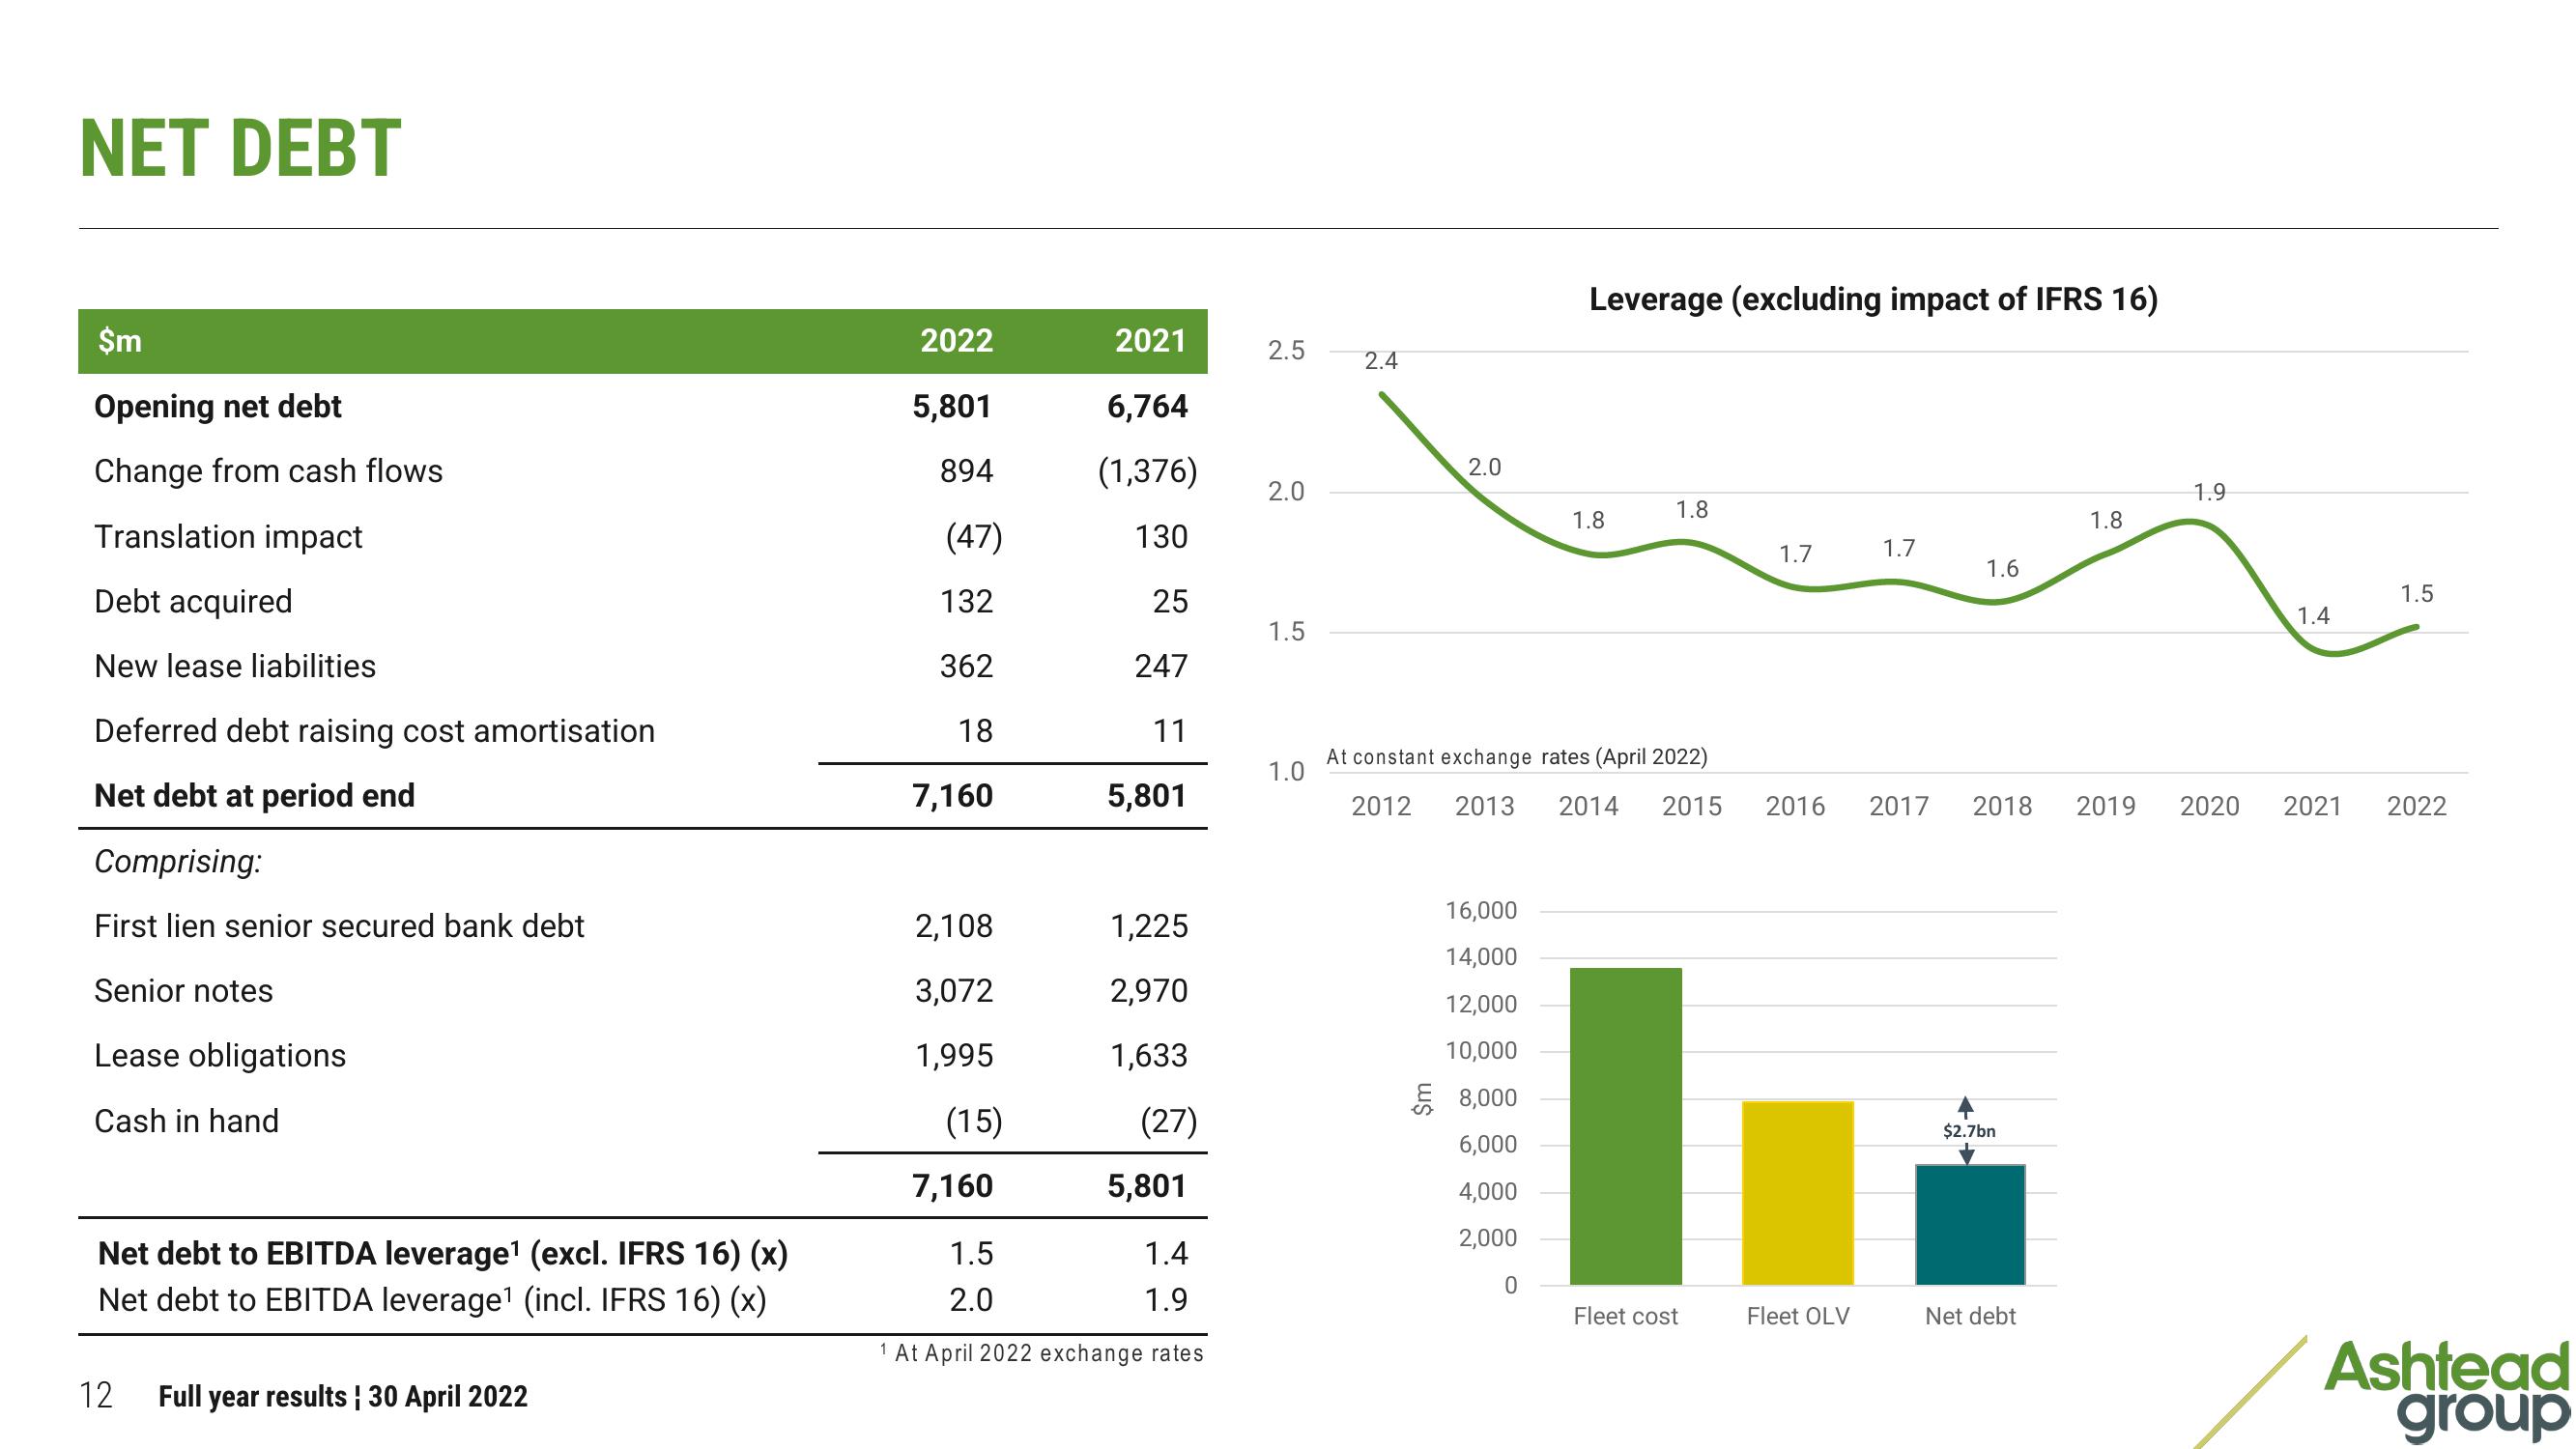
NET DEBT
$m
Opening net debt
Change from cash flows
Translation impact
Debt acquired
New lease liabilities
Deferred debt raising cost amortisation
Net debt at period end
Comprising:
First lien senior secured bank debt
Senior notes
Lease obligations
Cash in hand
Net debt to EBITDA leverage¹ (excl. IFRS 16) (x)
Net debt to EBITDA leverage¹ (incl. IFRS 16) (x)
12 Full year results | 30 April 2022
2022
5,801
894
(47)
132
362
18
7,160
2,108
3,072
1,995
(15)
7,160
2021
6,764
(1,376)
130
25
247
11
5,801
1,225
2,970
1,633
(27)
5,801
1.4
1.5
2.0
1.9
1 At April 2022 exchange rates
2.5
2.0
1.5
1.0
2.4
2.0
Leverage (excluding impact of IFRS 16)
1.8
16,000
14,000
12,000
10,000
8,000
6,000
4,000
2,000
0
1.8
At constant exchange rates (April 2022)
2012
1.7
2013 2014 2015 2016 2017
Fleet cost
1.7
Fleet OLV
1.6
2018
$2.7bn
Net debt
1.8
1.9
2019 2020
1.4
2021
1.5
2022
Ashtead
groupView entire presentation