2022 Investor Day
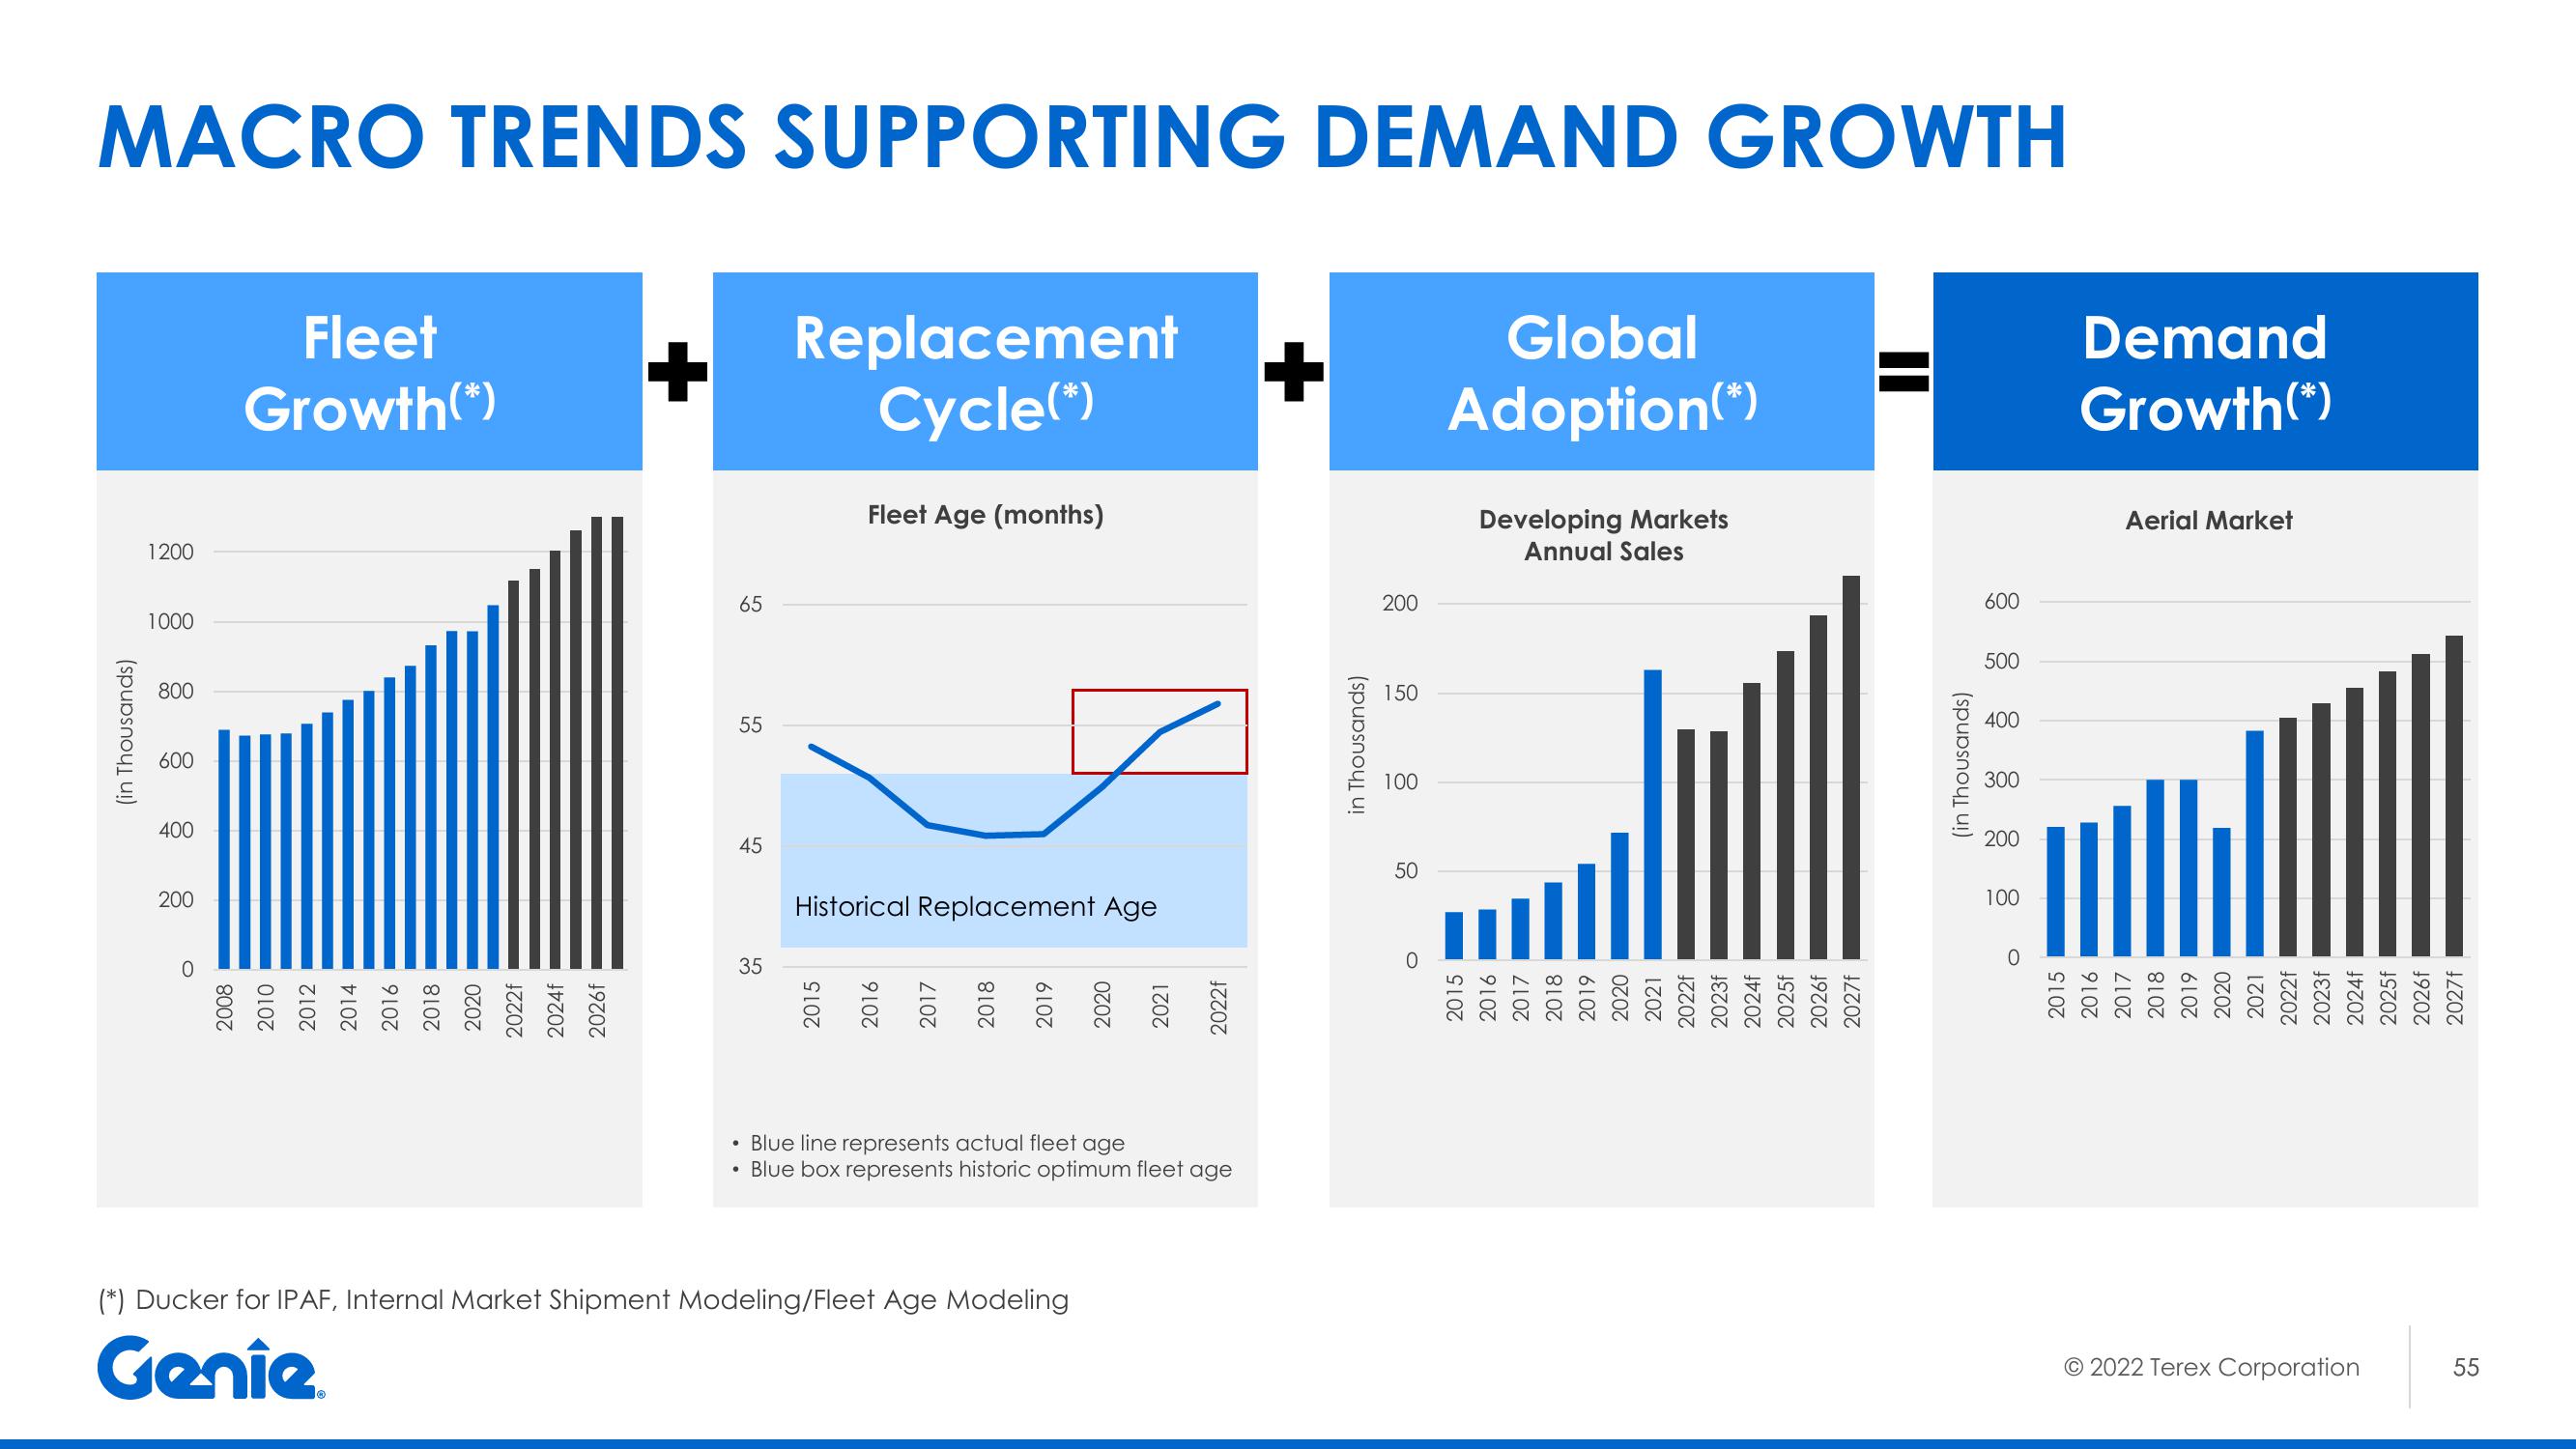
MACRO TRENDS SUPPORTING DEMAND GROWTH
(in Thousands)
1200
1000
800
009
400
200
Fleet
Growth(*)
2008
2010
2012
2014
2016
2018
2020
2022f
2024f
2026f
+
Ⓒ
65
55
45
35
●
Replacement
Cycle(*)
Fleet Age (months)
Historical Replacement Age
2015
2016
2017
2018
2019
Blue line represents actual fleet age
Blue box represents historic optimum fleet age
(*) Ducker for IPAF, Internal Market Shipment Modeling/Fleet Age Modeling
Genie
+
in Thousands)
200
150
100
50
O
Global
Adoption(*)
Developing Markets
Annual Sales
2015
2016
2017
2018
2019
2020
2021
2022f
2023f
2024f
2025f
2026f
2027f
(in Thousands)
009
500
400
300
200
100
0
Demand
Growth(*)
Aerial Market
2015
2016
2017
2018
2019
2020
2021
2022f
2023f
2024f
2025f
2026f
2027f
© 2022 Terex Corporation
55View entire presentation