Melrose Mergers and Acquisitions Presentation Deck
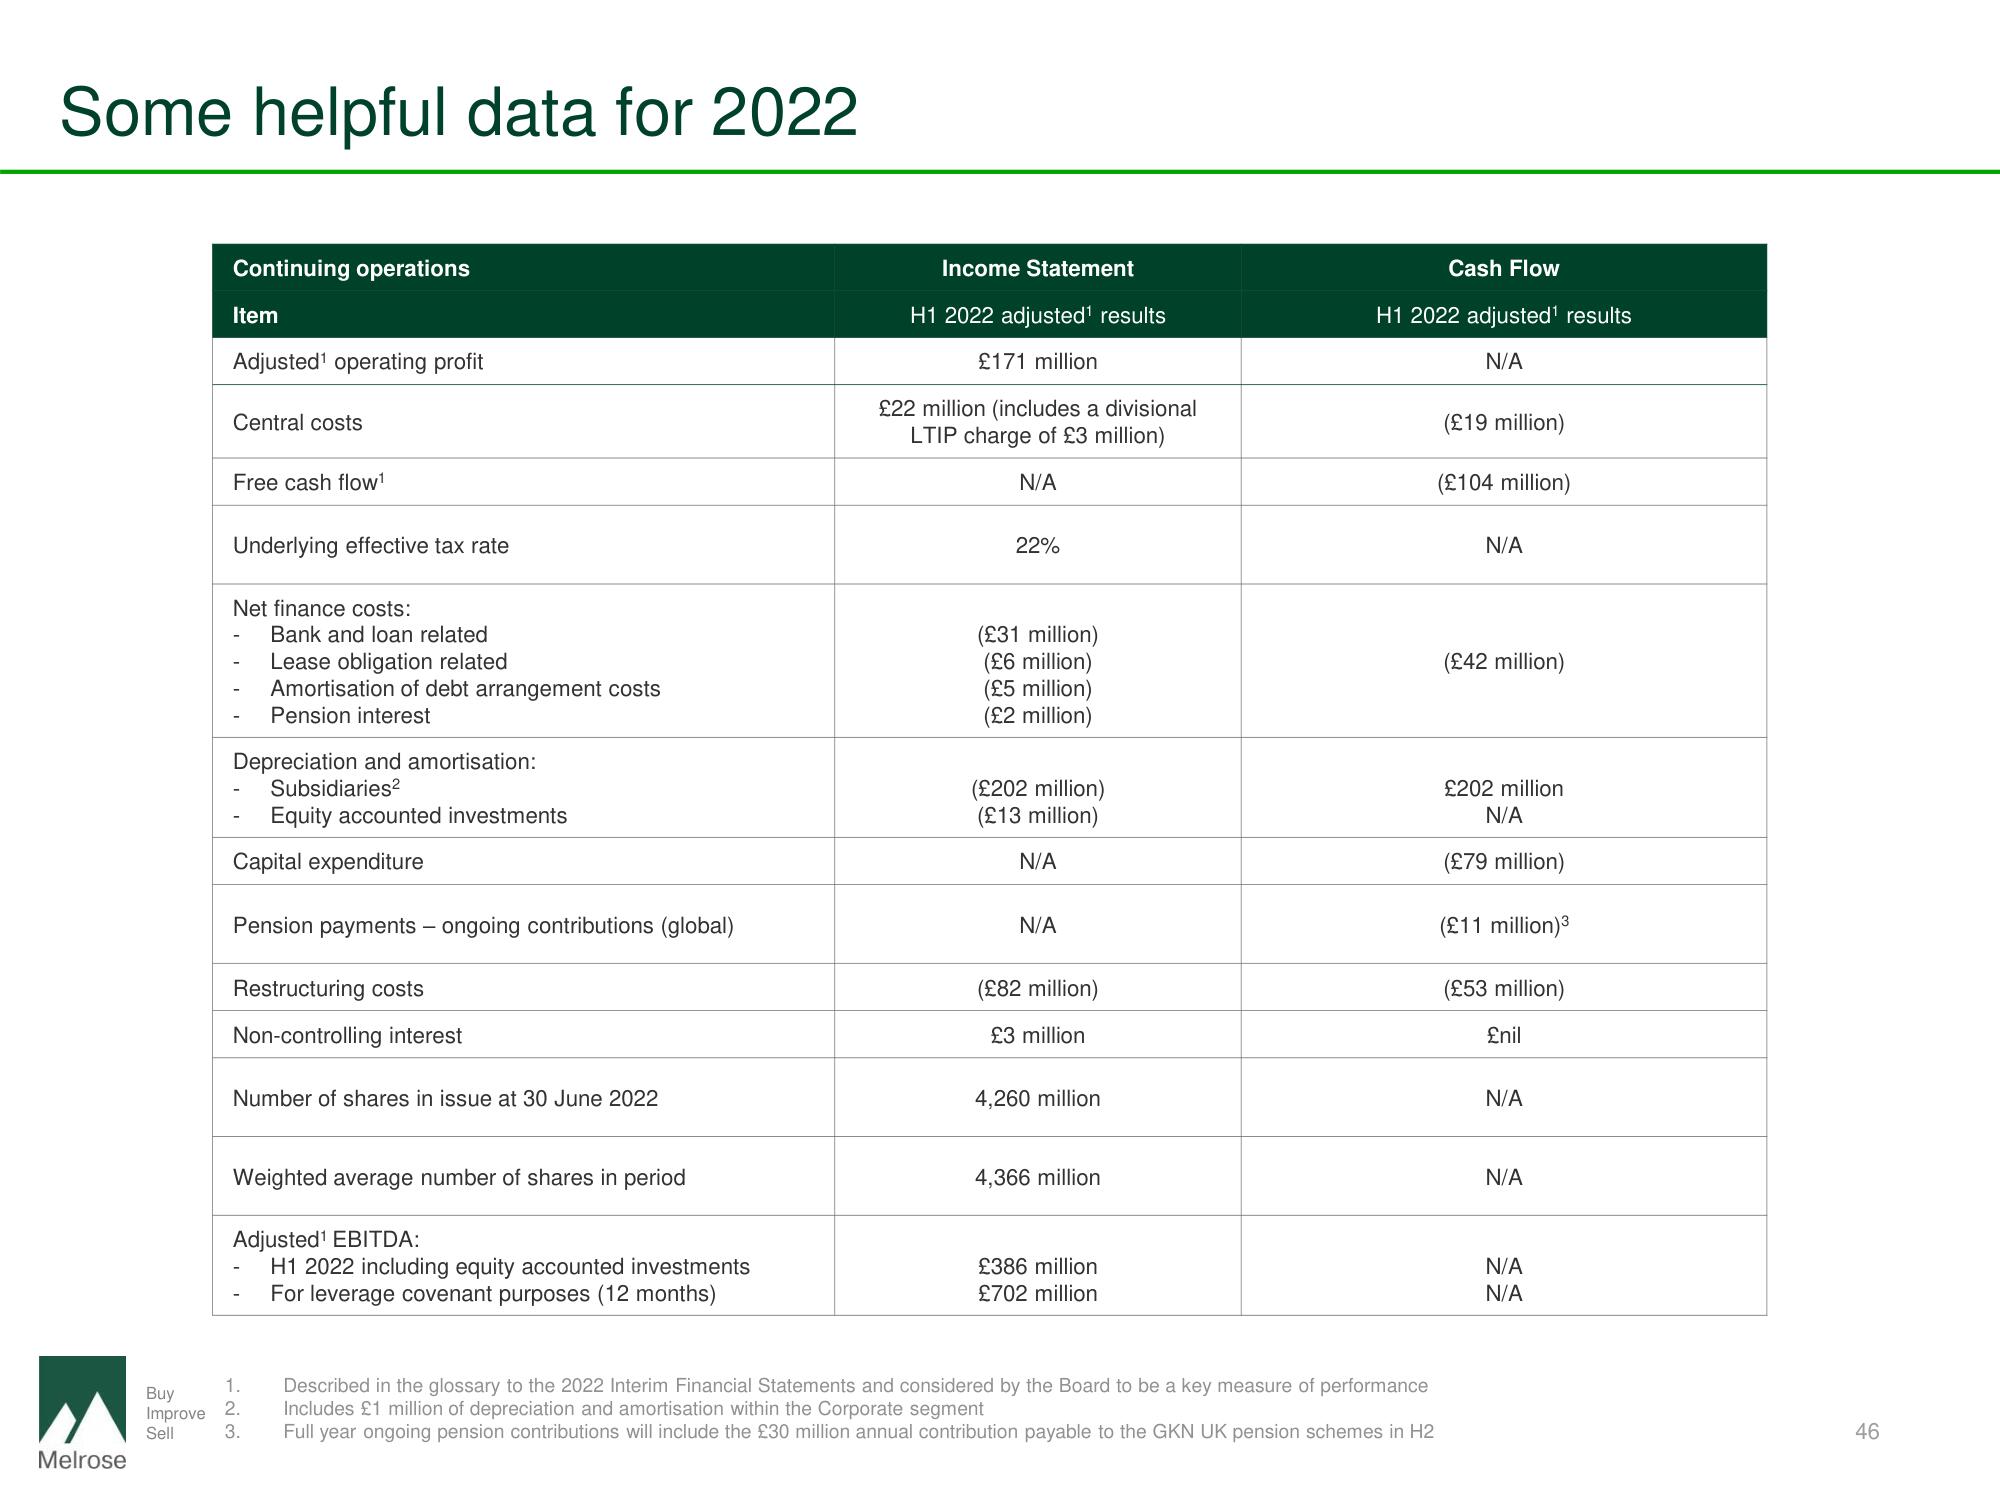
Some helpful data for 2022
Melrose
Continuing operations
Item
Adjusted¹ operating profit
Central costs
Free cash flow¹
Underlying effective tax rate
Net finance costs:
Bank and loan related
Lease obligation related
Amortisation of debt arrangement costs
Pension interest
Depreciation and amortisation:
Subsidiaries²
Equity accounted investments
Capital expenditure
Pension payments - ongoing contributions (global)
Restructuring costs
Non-controlling interest
Number of shares in issue at 30 June 2022
Weighted average number of shares in period
Adjusted¹ EBITDA:
H1 2022 including equity accounted investments
For leverage covenant purposes (12 months)
1.
Buy
Improve 2.
Sell
3.
Income Statement
H1 2022 adjusted¹ results
£171 million
£22 million (includes a divisional
LTIP charge of £3 million)
N/A
22%
(£31 million)
(£6 million)
(£5 million)
(£2 million)
(£202 million)
(£13 million)
N/A
N/A
(£82 million)
£3 million
4,260 million
4,366 million
£386 million
£702 million
Cash Flow
H1 2022 adjusted¹ results
N/A
Described in the glossary to the 2022 Interim Financial Statements and considered by the Board to be a key measure of performance
Includes £1 million of depreciation and amortisation within the Corporate segment
Full year ongoing pension contributions will include the £30 million annual contribution payable to the GKN UK pension schemes in H2
(£19 million)
(£104 million)
N/A
(£42 million)
£202 million
N/A
(£79 million)
(£11 million) ³
(£53 million)
£nil
N/A
N/A
N/A
N/A
46View entire presentation