Kinnevik Results Presentation Deck
Intro
SEK m
GROUP FINANCIAL STATEMENTS
Change in fair value of financial assets
Dividends received
Condensed Consolidated Income Statement and report concerning Total Comprehensive Income
Administration costs
Other operating income
Other operating expenses
Operating profit/loss
Net Asset Value
Interest income and other financial income
Interest expenses and other financial expenses
Profit/loss after financial net
Tax
Net profit/loss for the period
Total comprehensive income for the period
Net profit/loss per share before dilution, SEK
Net profit/loss per share after dilution, SEK
Outstanding shares at the end of the period
Average number of shares before dilution
Average number of shares after dilution
Portfolio Overview
KINNEVIK
Sustainability
Interim Report Q1 2022
Financial Statements
Note
4
5
Other
Q1 2022
-4 589
-58
2
0
-4 645
159
-55
-4541
0
-4541
-4 541
-16.29
-16.29
278 677 265
278 677 265
278 677 265
Q1 2021
6 136
-69
3
0
6 070
35
-33
6 072
0
6 072
6 072
21.86
21.86
277 775 037
277 775 037
277 775 037
FY 2021
13 269
1 689
-319
10
-3
14 646
210
-74
14 782
-5
14 777
14 777
53.12
53.12
278 677 265
278 177 851
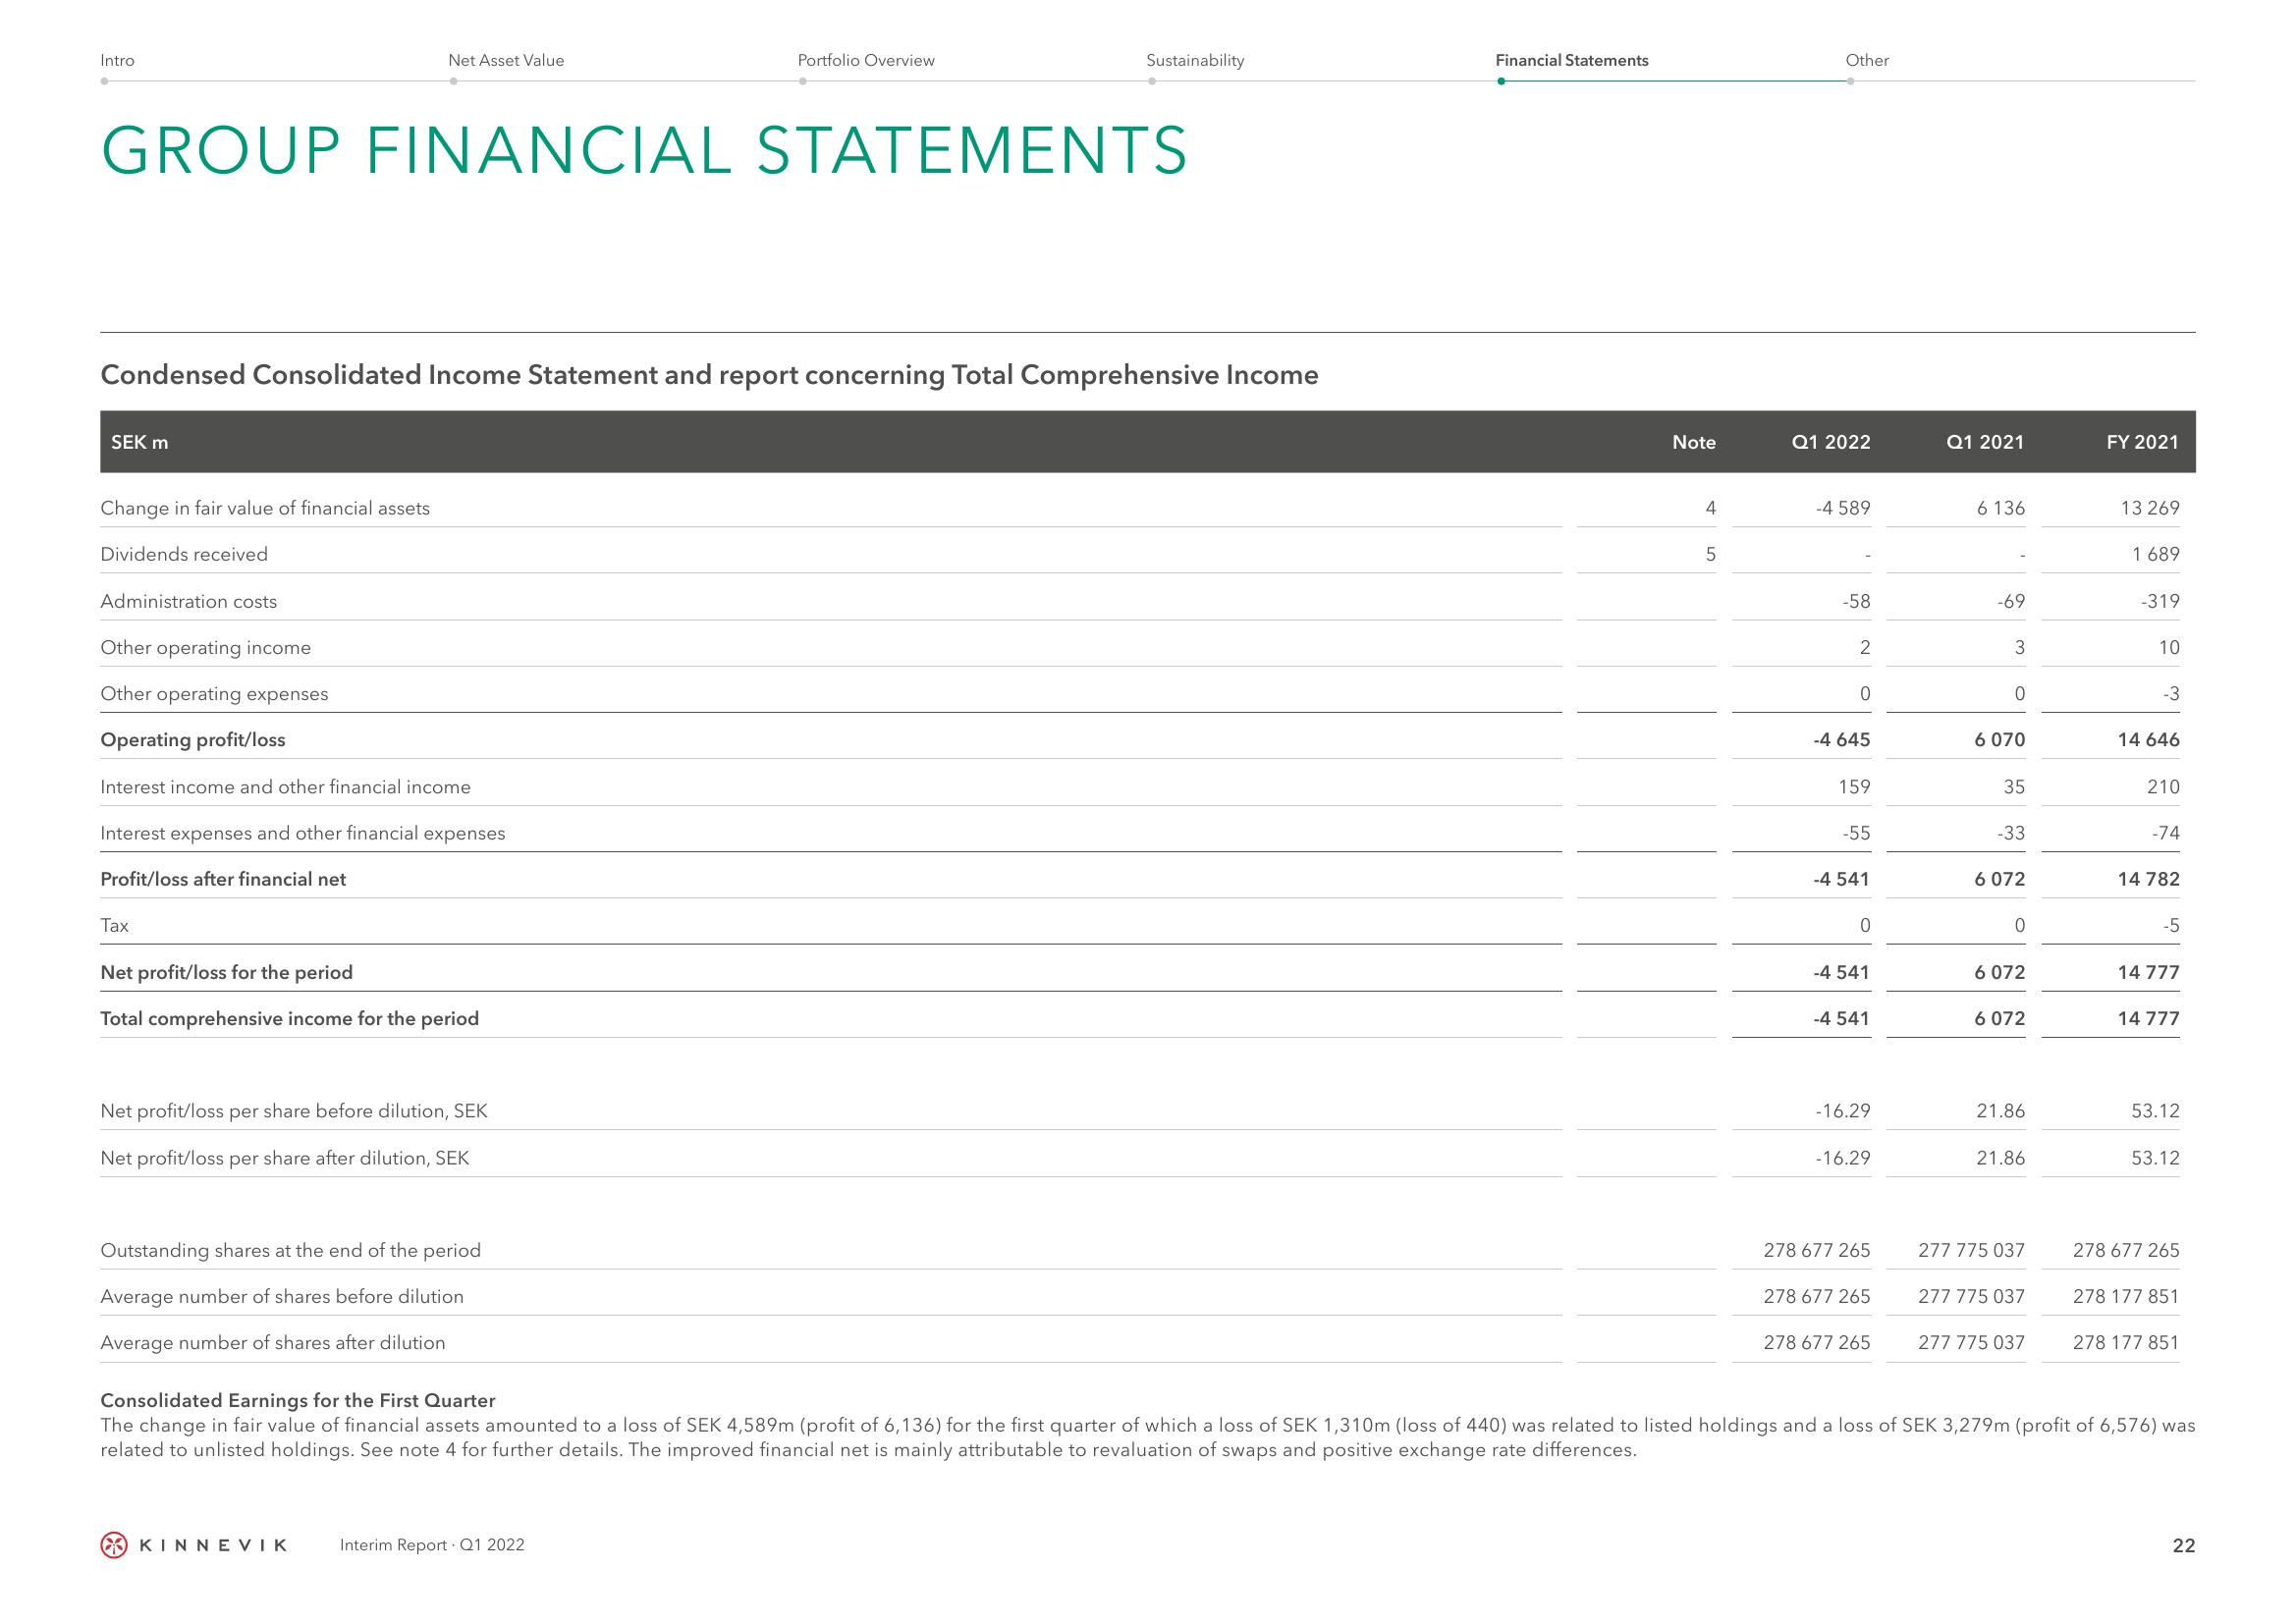
Consolidated Earnings for the First Quarter
The change in fair value of financial assets amounted to a loss of SEK 4,589m (profit of 6,136) for the first quarter of which a loss of SEK 1,310m (loss of 440) was related to listed holdings and a loss of SEK 3,279m (profit of 6,576) was
related to unlisted holdings. See note 4 for further details. The improved financial net is mainly attributable to revaluation of swaps and positive exchange rate differences.
278 177 851
22View entire presentation