Nexters SPAC Presentation Deck
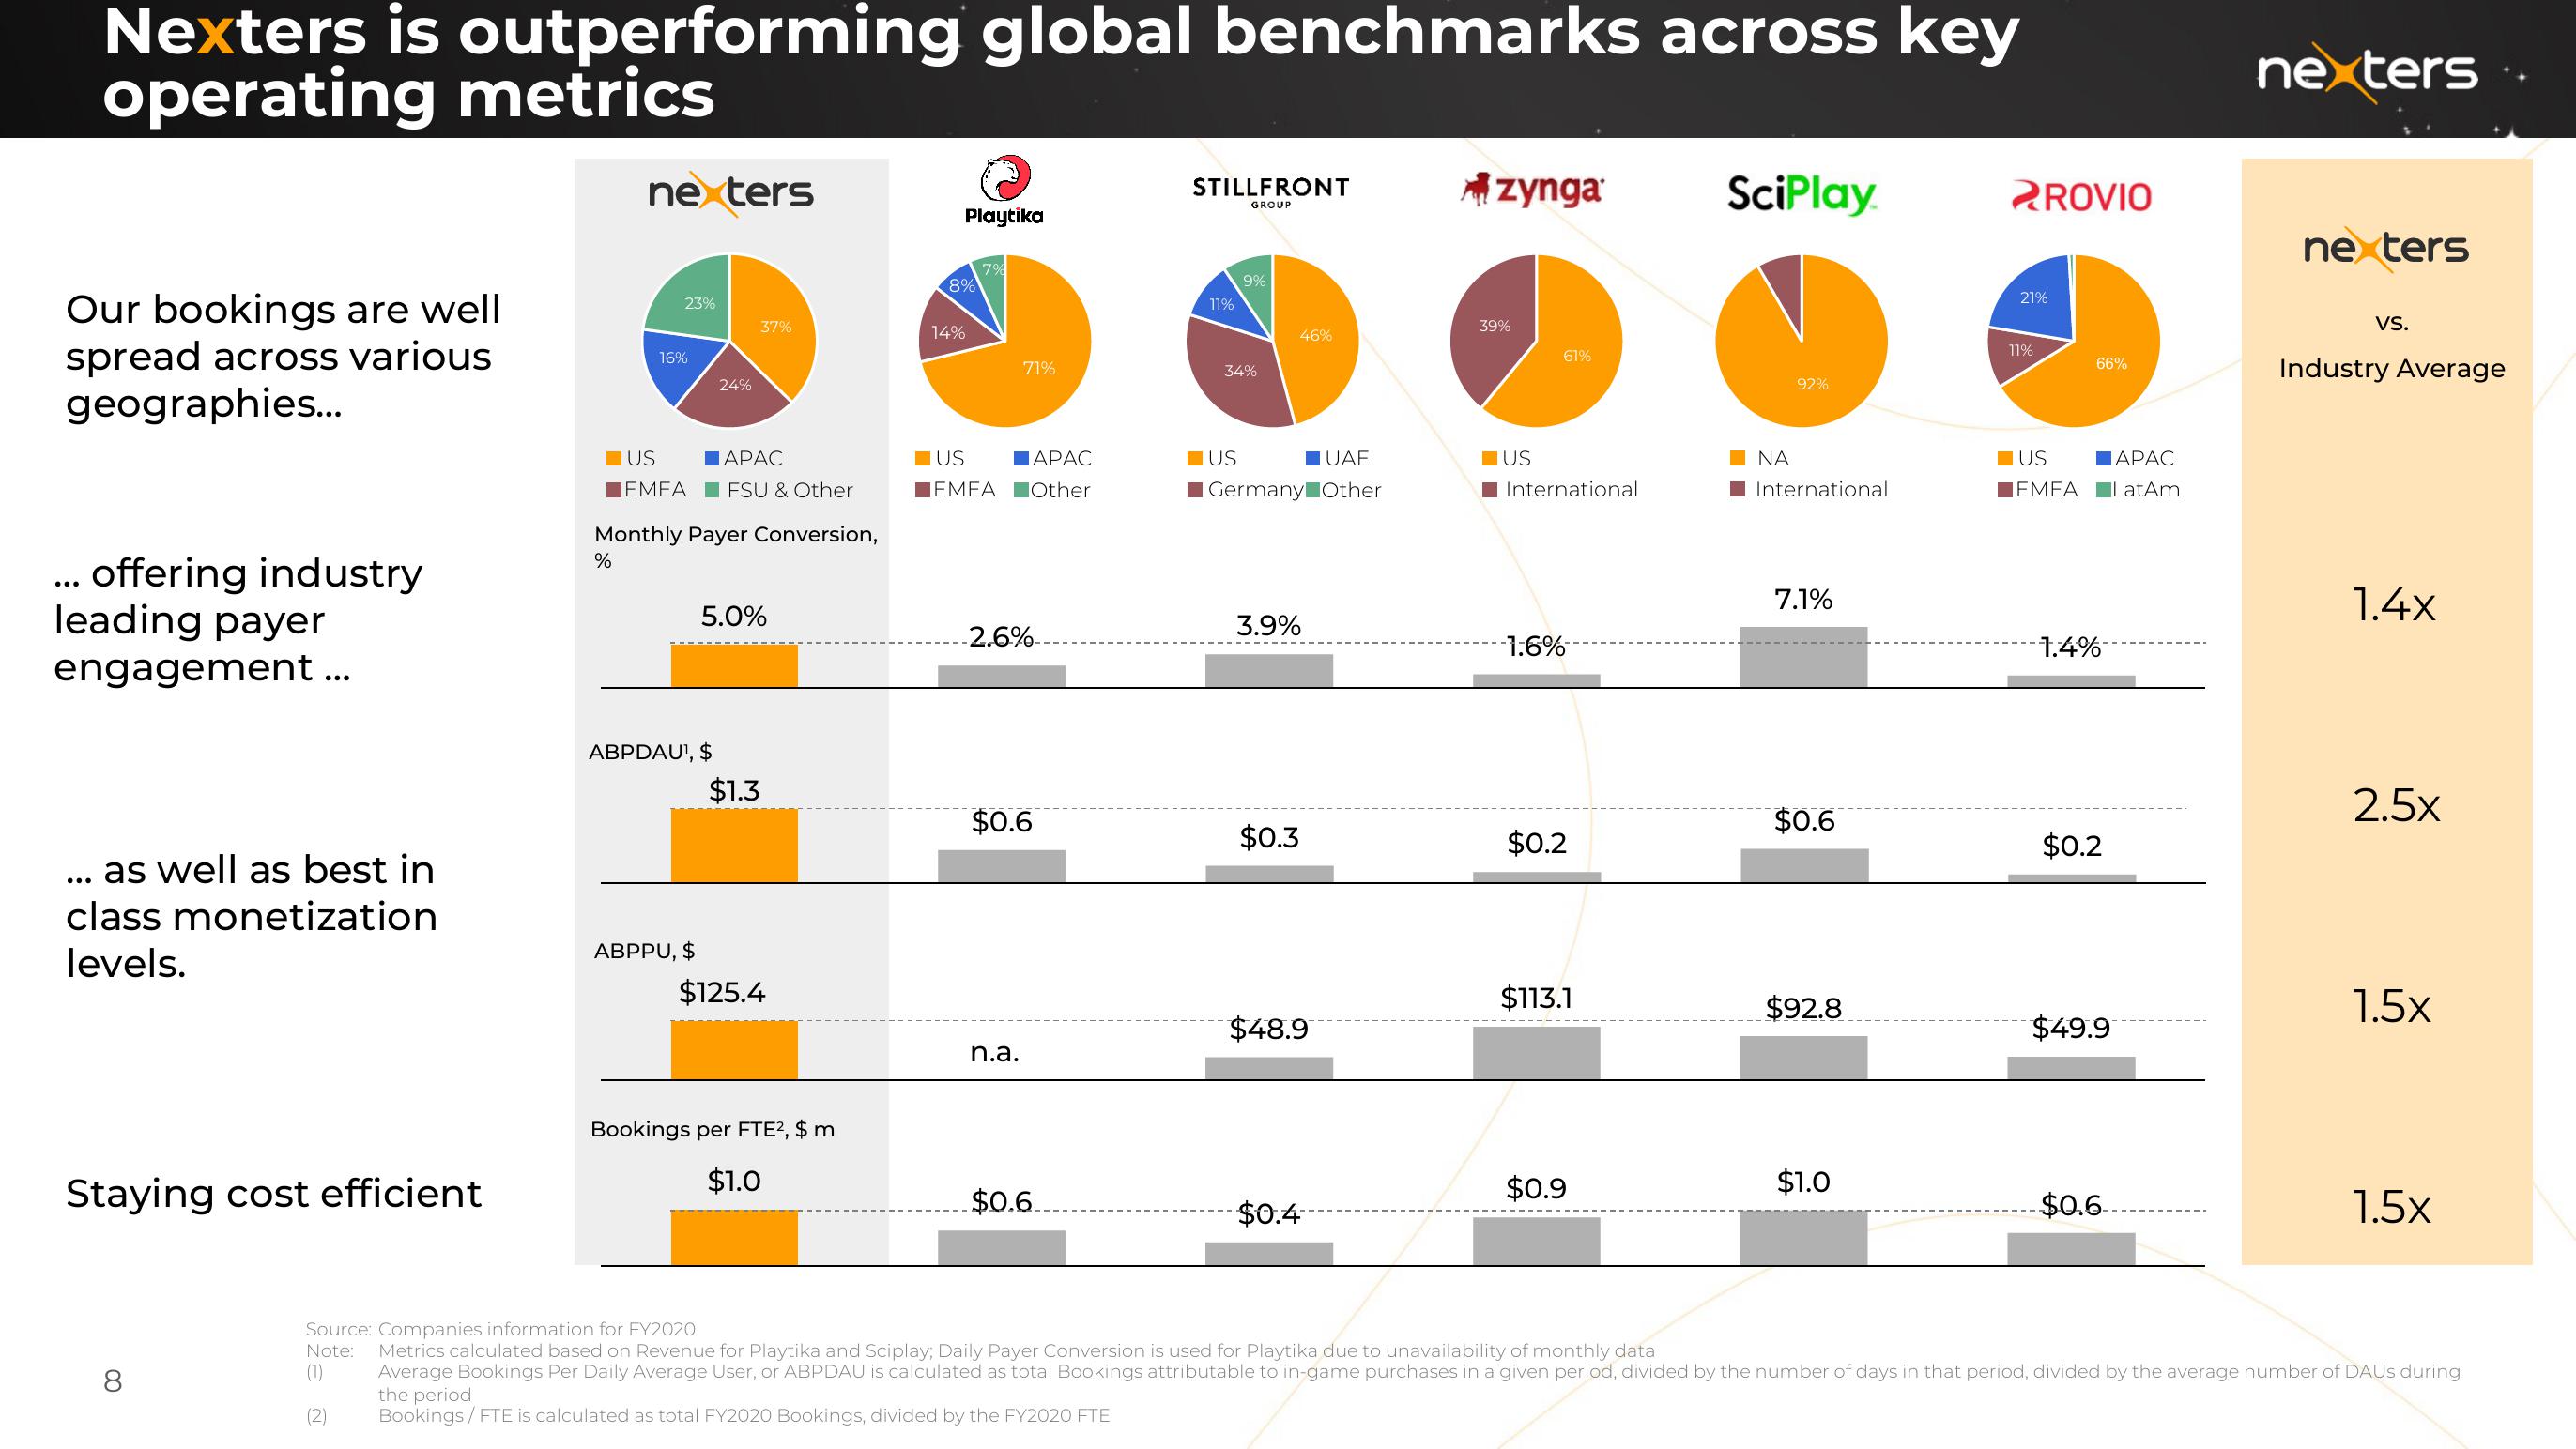
Nexters is outperforming global benchmarks across key
operating metrics
Our bookings are well
spread across various
geographies...
...
offering industry
leading payer
engagement...
as well as best in
class monetization
levels.
Staying cost efficient
8
ne ters
23%
16%
24%
US
IAPAC
EMEA FSU & Other
Monthly Payer Conversion,
%
ABPDAU¹, $
ABPPU, $
37%
5.0%
$1.3
$125.4
Bookings per FTE², $ m
$1.0
Playtika
8%
14%
7%
71%
US
IAPAC
EMEA Other
-2.6%-
$0.6
n.a.
$0.6.
STILLFRONT
GROUP
11%
9%
34%
US
UAE
Germany Other
46%
3.9%
$0.3
$48.9
$0.4
zynga
39%
US
61%
International
-1.6%
$0.2
$113.1
$0.9
SciPlay
ΝΑ
92%
International
7.1%
0.6
$92.8
$1.0
PROVIO
21%
11%
66%
US
APAC
IEMEA LatAm
1.4%
$0.2
$49.9
$0.6
nexters
ne ters
VS.
Industry Average
1.4x
2.5x
1.5x
1.5x
Source: Companies information for FY2020
Note:
(1)
Metrics calculated based on Revenue for Playtika and Sciplay, Daily Payer Conversion is used for Playtika due to unavailability of monthly data
Average Bookings Per Daily Average User, or ABPDAU is calculated as total Bookings attributable to in-game purchases in a given period, divided by the number of days in that period, divided by the average number of DAUS during
the period
Bookings/FTE is calculated as total FY2020 Bookings, divided by the FY2020 FTE
(2)View entire presentation