Kinnevik Results Presentation Deck
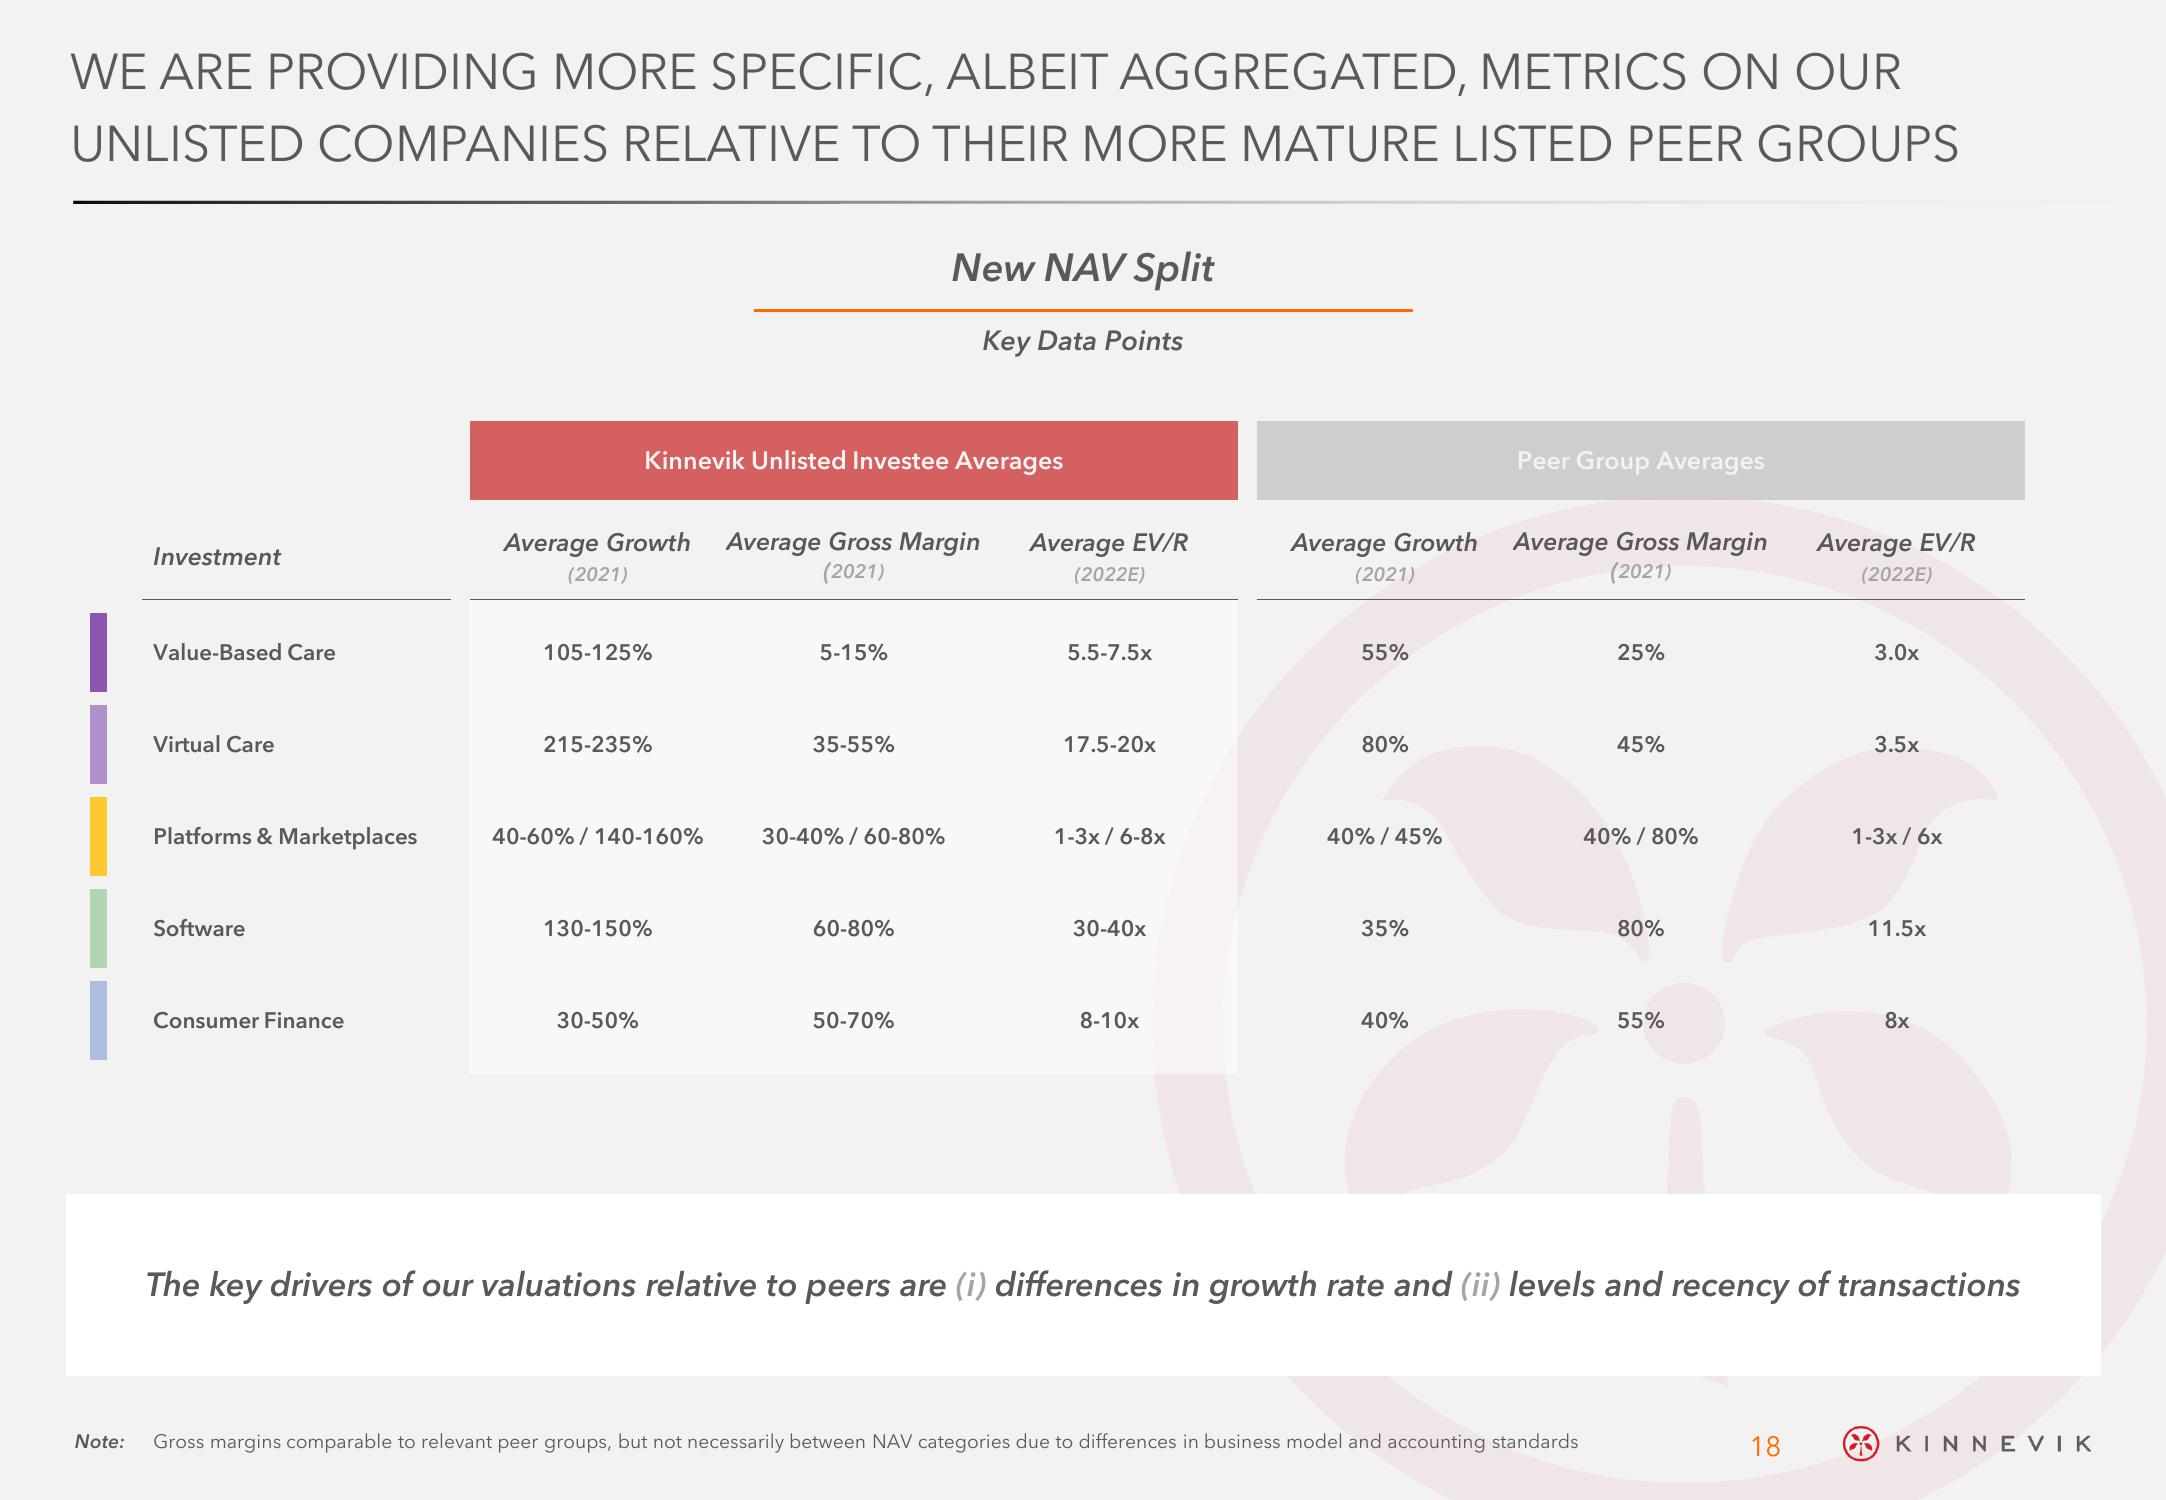
WE ARE PROVIDING MORE SPECIFIC, ALBEIT AGGREGATED, METRICS ON OUR
UNLISTED COMPANIES RELATIVE TO THEIR MORE MATURE LISTED PEER GROUPS
Note:
Investment
Value-Based Care
Virtual Care
Platforms & Marketplaces
Software
Consumer Finance
Average Growth
(2021)
Kinnevik Unlisted Investee Averages
105-125%
215-235%
40-60% / 140-160%
130-150%
30-50%
Average Gross Margin
(2021)
5-15%
35-55%
30-40% / 60-80%
New NAV Split
Key Data Points
60-80%
50-70%
Average EV/R
(2022E)
5.5-7.5x
17.5-20x
1-3x/6-8x
30-40x
8-10x
Average Growth
(2021)
55%
80%
40% / 45%
35%
40%
Peer Group Averages
Average Gross Margin
(2021)
25%
Gross margins comparable to relevant peer groups, but not necessarily between NAV categories due to differences in business model and accounting standards
45%
40% / 80%
80%
55%
Average EV/R
(2022E)
18
3.0x
3.5x
1-3x/6x
11.5x
The key drivers of our valuations relative to peers are (i) differences in growth rate and (ii) levels and recency of transactions
8x
KINNEVIKView entire presentation