Cloudera Investor Presentation Deck
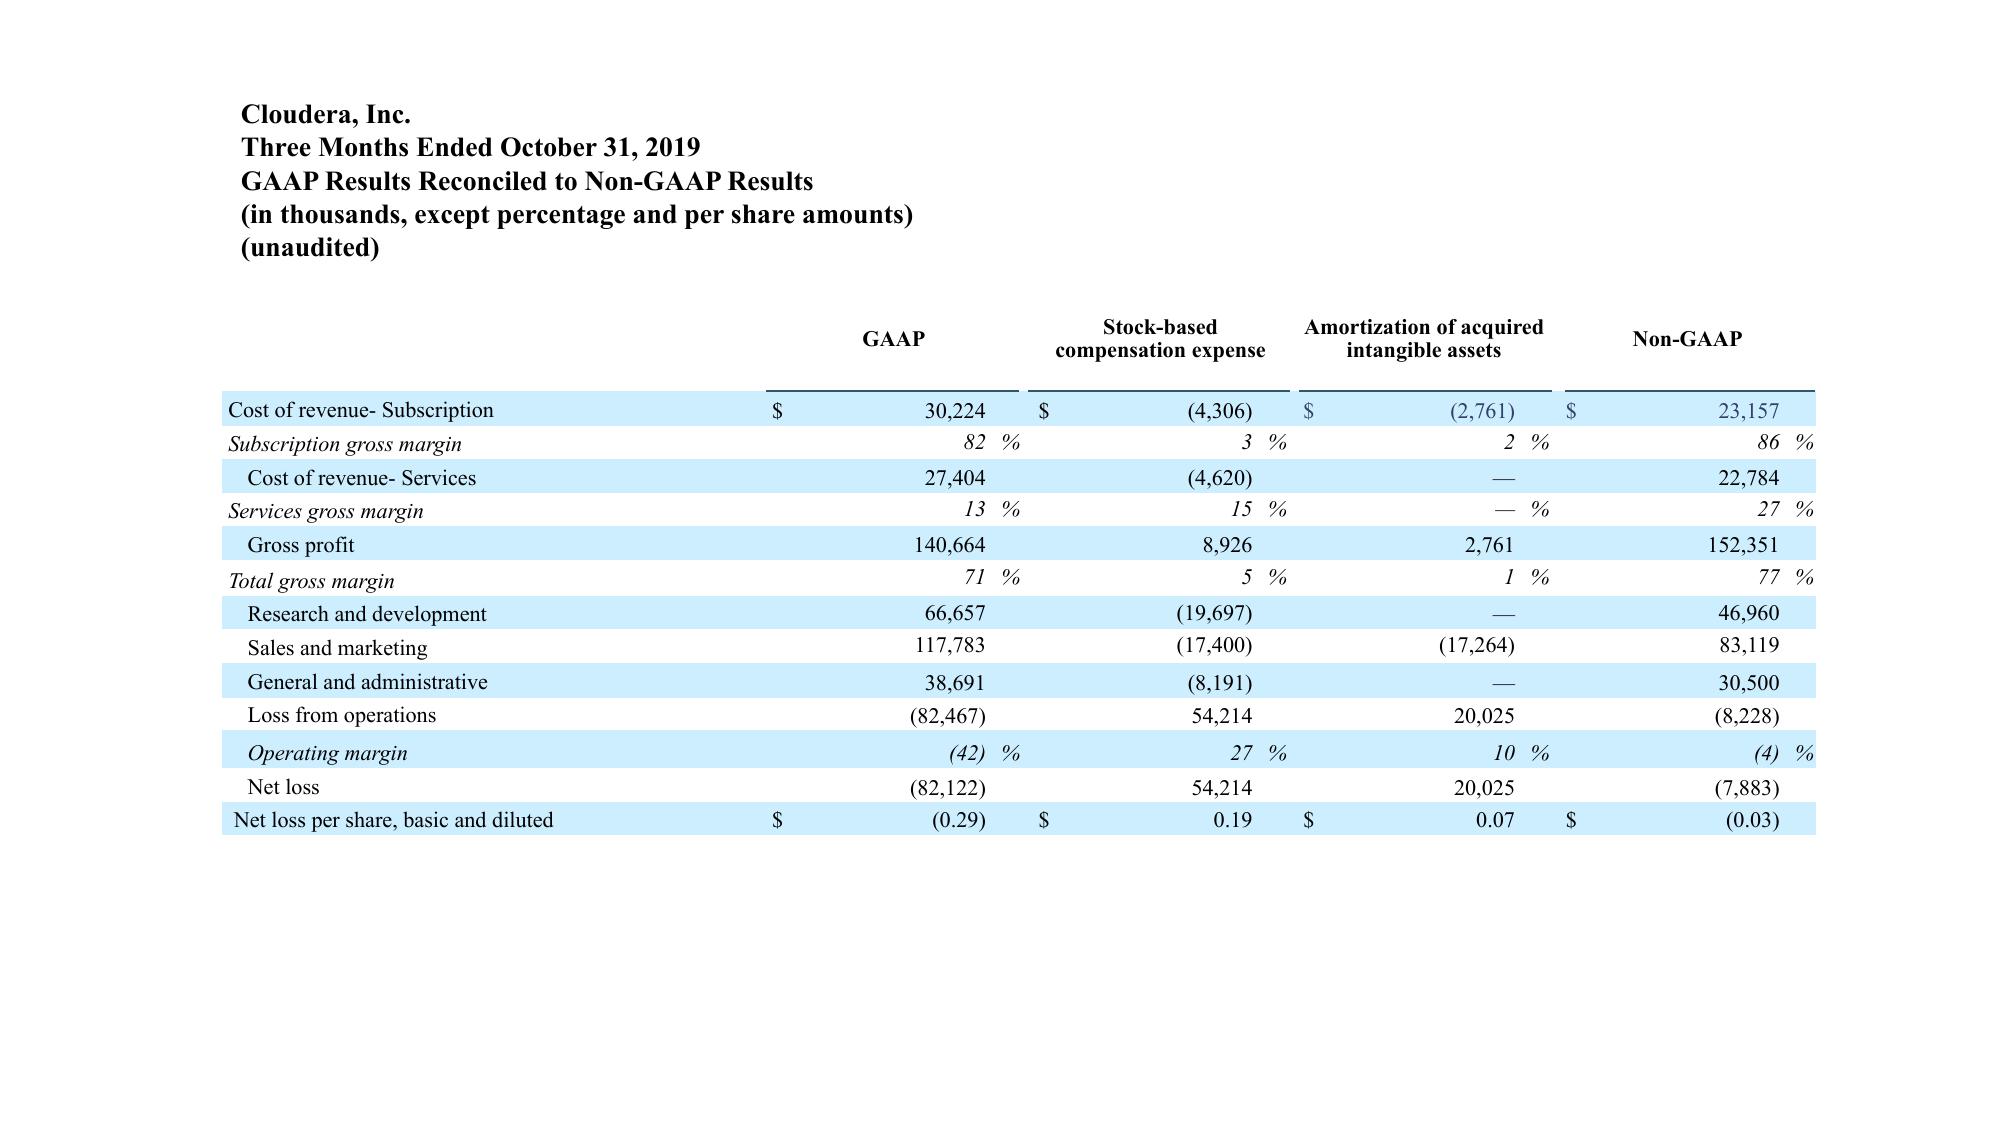
Cloudera, Inc.
Three Months Ended October 31, 2019
GAAP Results Reconciled to Non-GAAP Results
(in thousands, except percentage and per share amounts)
(unaudited)
Cost of revenue- Subscription
Subscription gross margin
Cost of revenue- Services
Services gross margin
Gross profit
Total gross margin
Research and development
Sales and marketing
General and administrative
Loss from operations
Operating margin
Net loss
Net loss per share, basic and diluted
$
$
GAAP
30,224
82%
27,404
13 %
140,664
71%
66,657
117,783
38,691
(82,467)
(42) %
(82,122)
(0.29)
$
$
Stock-based
compensation expense
(4,306)
3%
(4,620)
15 %
8,926
5 %
(19,697)
(17,400)
(8,191)
54,214
27 %
54,214
0.19
Amortization of acquired
intangible assets
$
$
(2,761)
2%
2,761
1%
(17,264)
20,025
%
10%
20,025
0.07
$
$
Non-GAAP
23,157
86%
22,784
27 %
152,351
77 %
46,960
83,119
30,500
(8,228)
(4) %
(7,883)
(0.03)View entire presentation